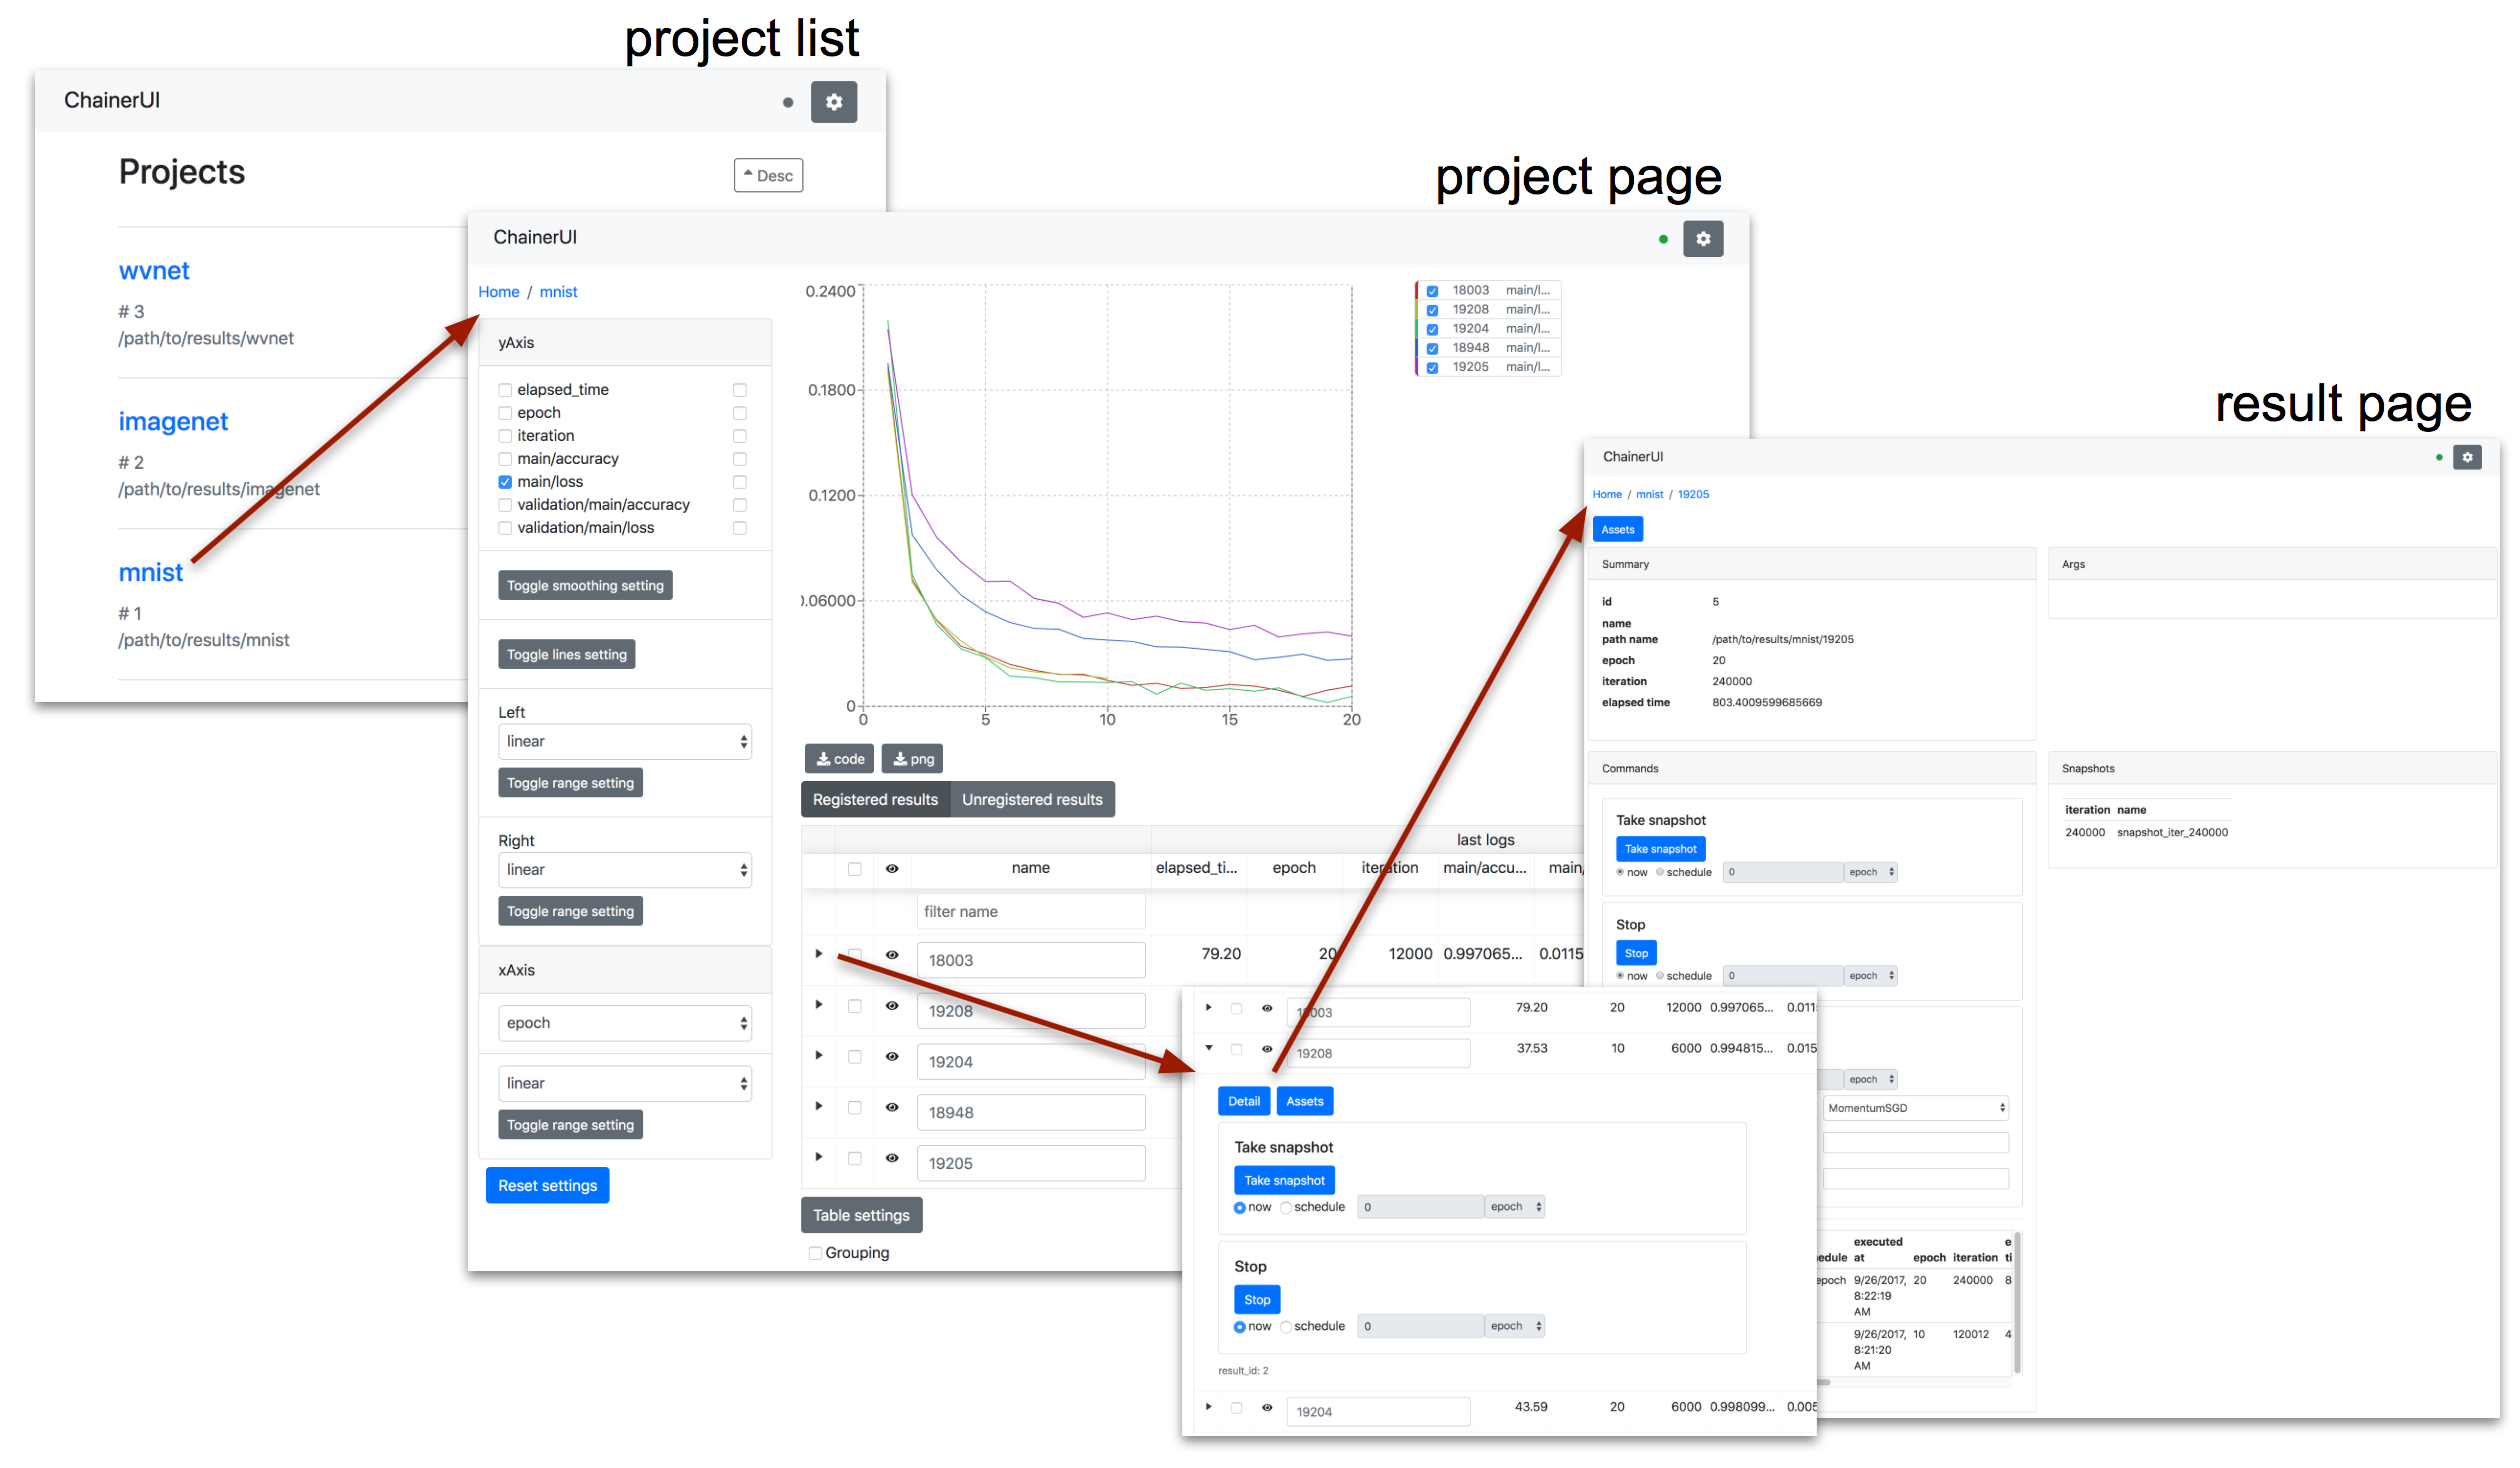
User interface manual
Page transition flow:
Header

 : setup global settings and show ChainerUI version.
See Global settings section below for more details.
: setup global settings and show ChainerUI version.
See Global settings section below for more details. : connection status between ChainerUI server
- green: success to connect
- blue: loading
- red: fail to connect
- gray: disable polling
Global settings
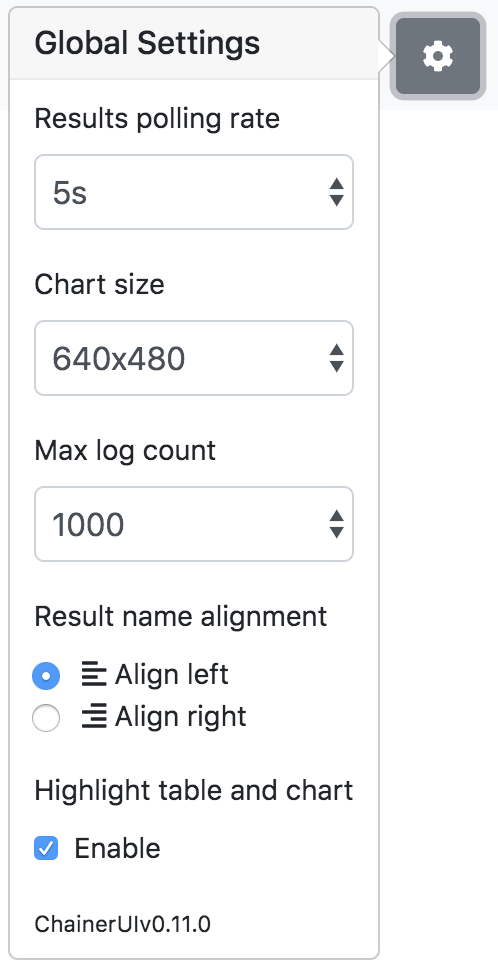
Results polling rate
Results polling rate is intervals between updates of results on project pages. When you feel your browser is slow, try choosing a longer value.
Chart size
Chart size is the size of the main plot on project pages.
Max log count
Max log count is the maximum number of logs per result that the ChainerUI server sends to the browser on each request. When you feel your browser is slow, try choosing a smaller value.
Result name alignment
Result name alignment controls which side of a result name to be truncated when it is too long to be displayed.
Highlight table and chart
Enable highlighting linked betwheen a table row and a log chart. Enabled on default.
Home: Project list
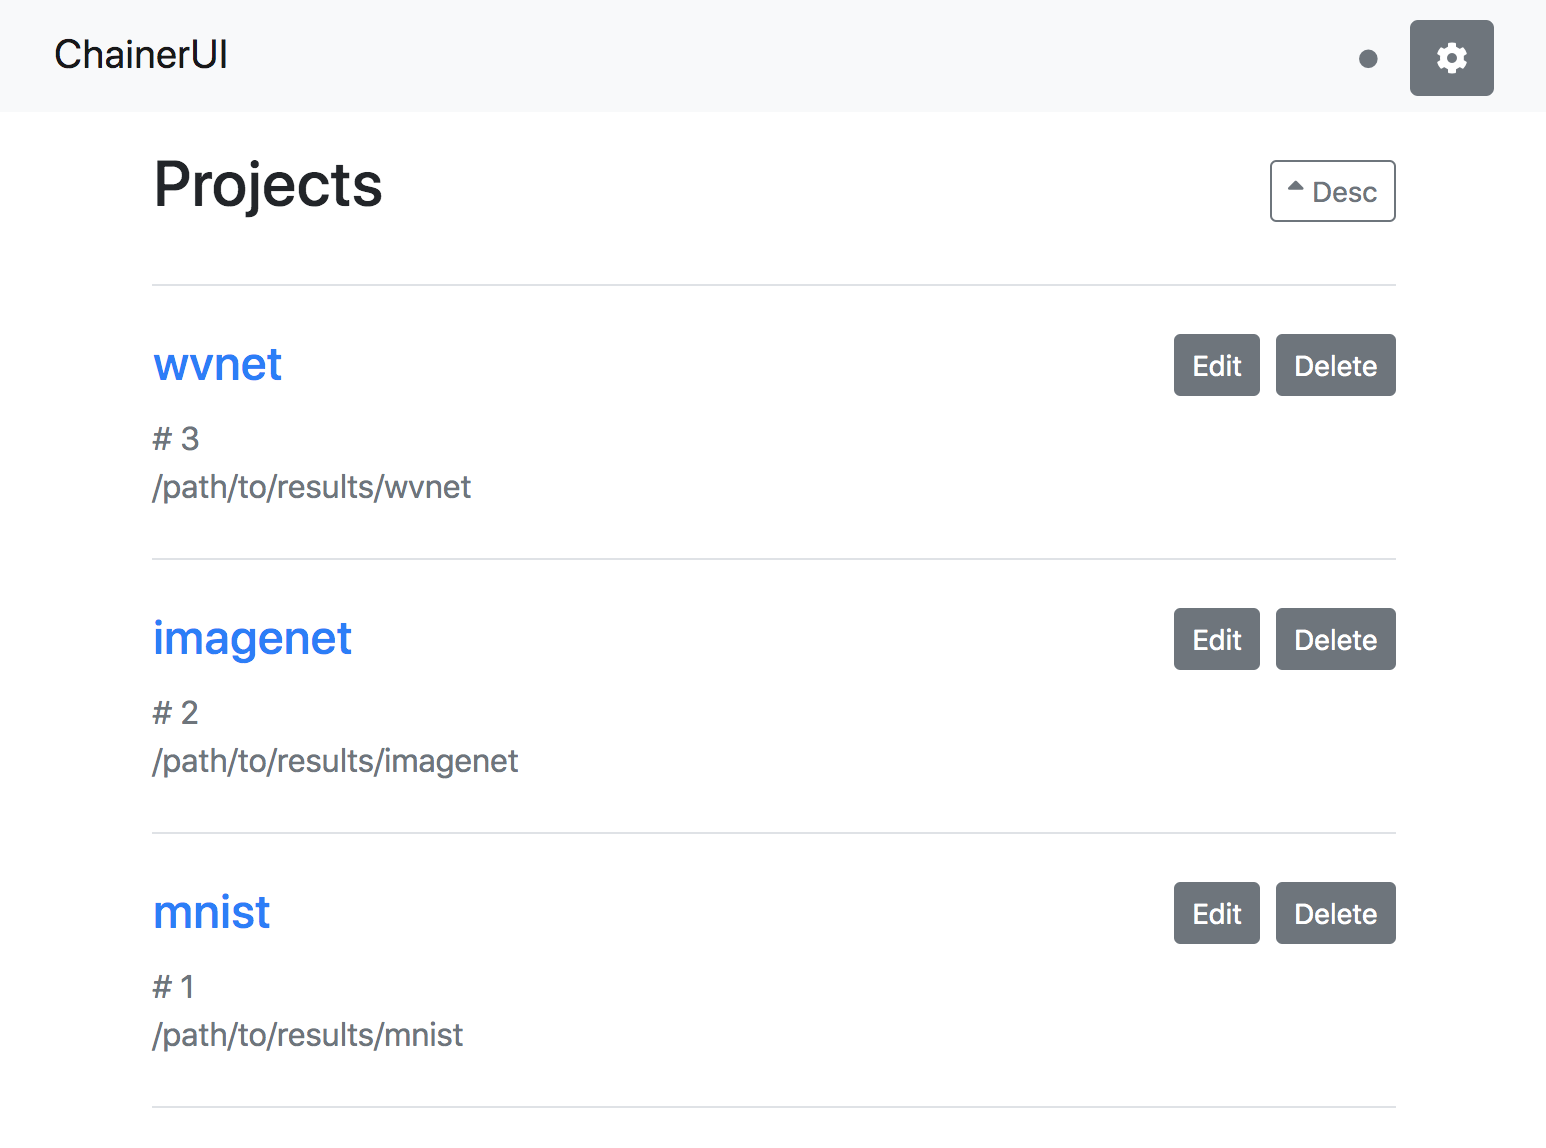
From the list of registered projects, select a project to transition to the project page. When registering a project within running server, refresh the page and it will show the project on the list. See Customize training loop.
Desc/Asc: select order of project list.Edit: edit the project name.Delete: delete the project from list.
Project: Show training chart and jobs
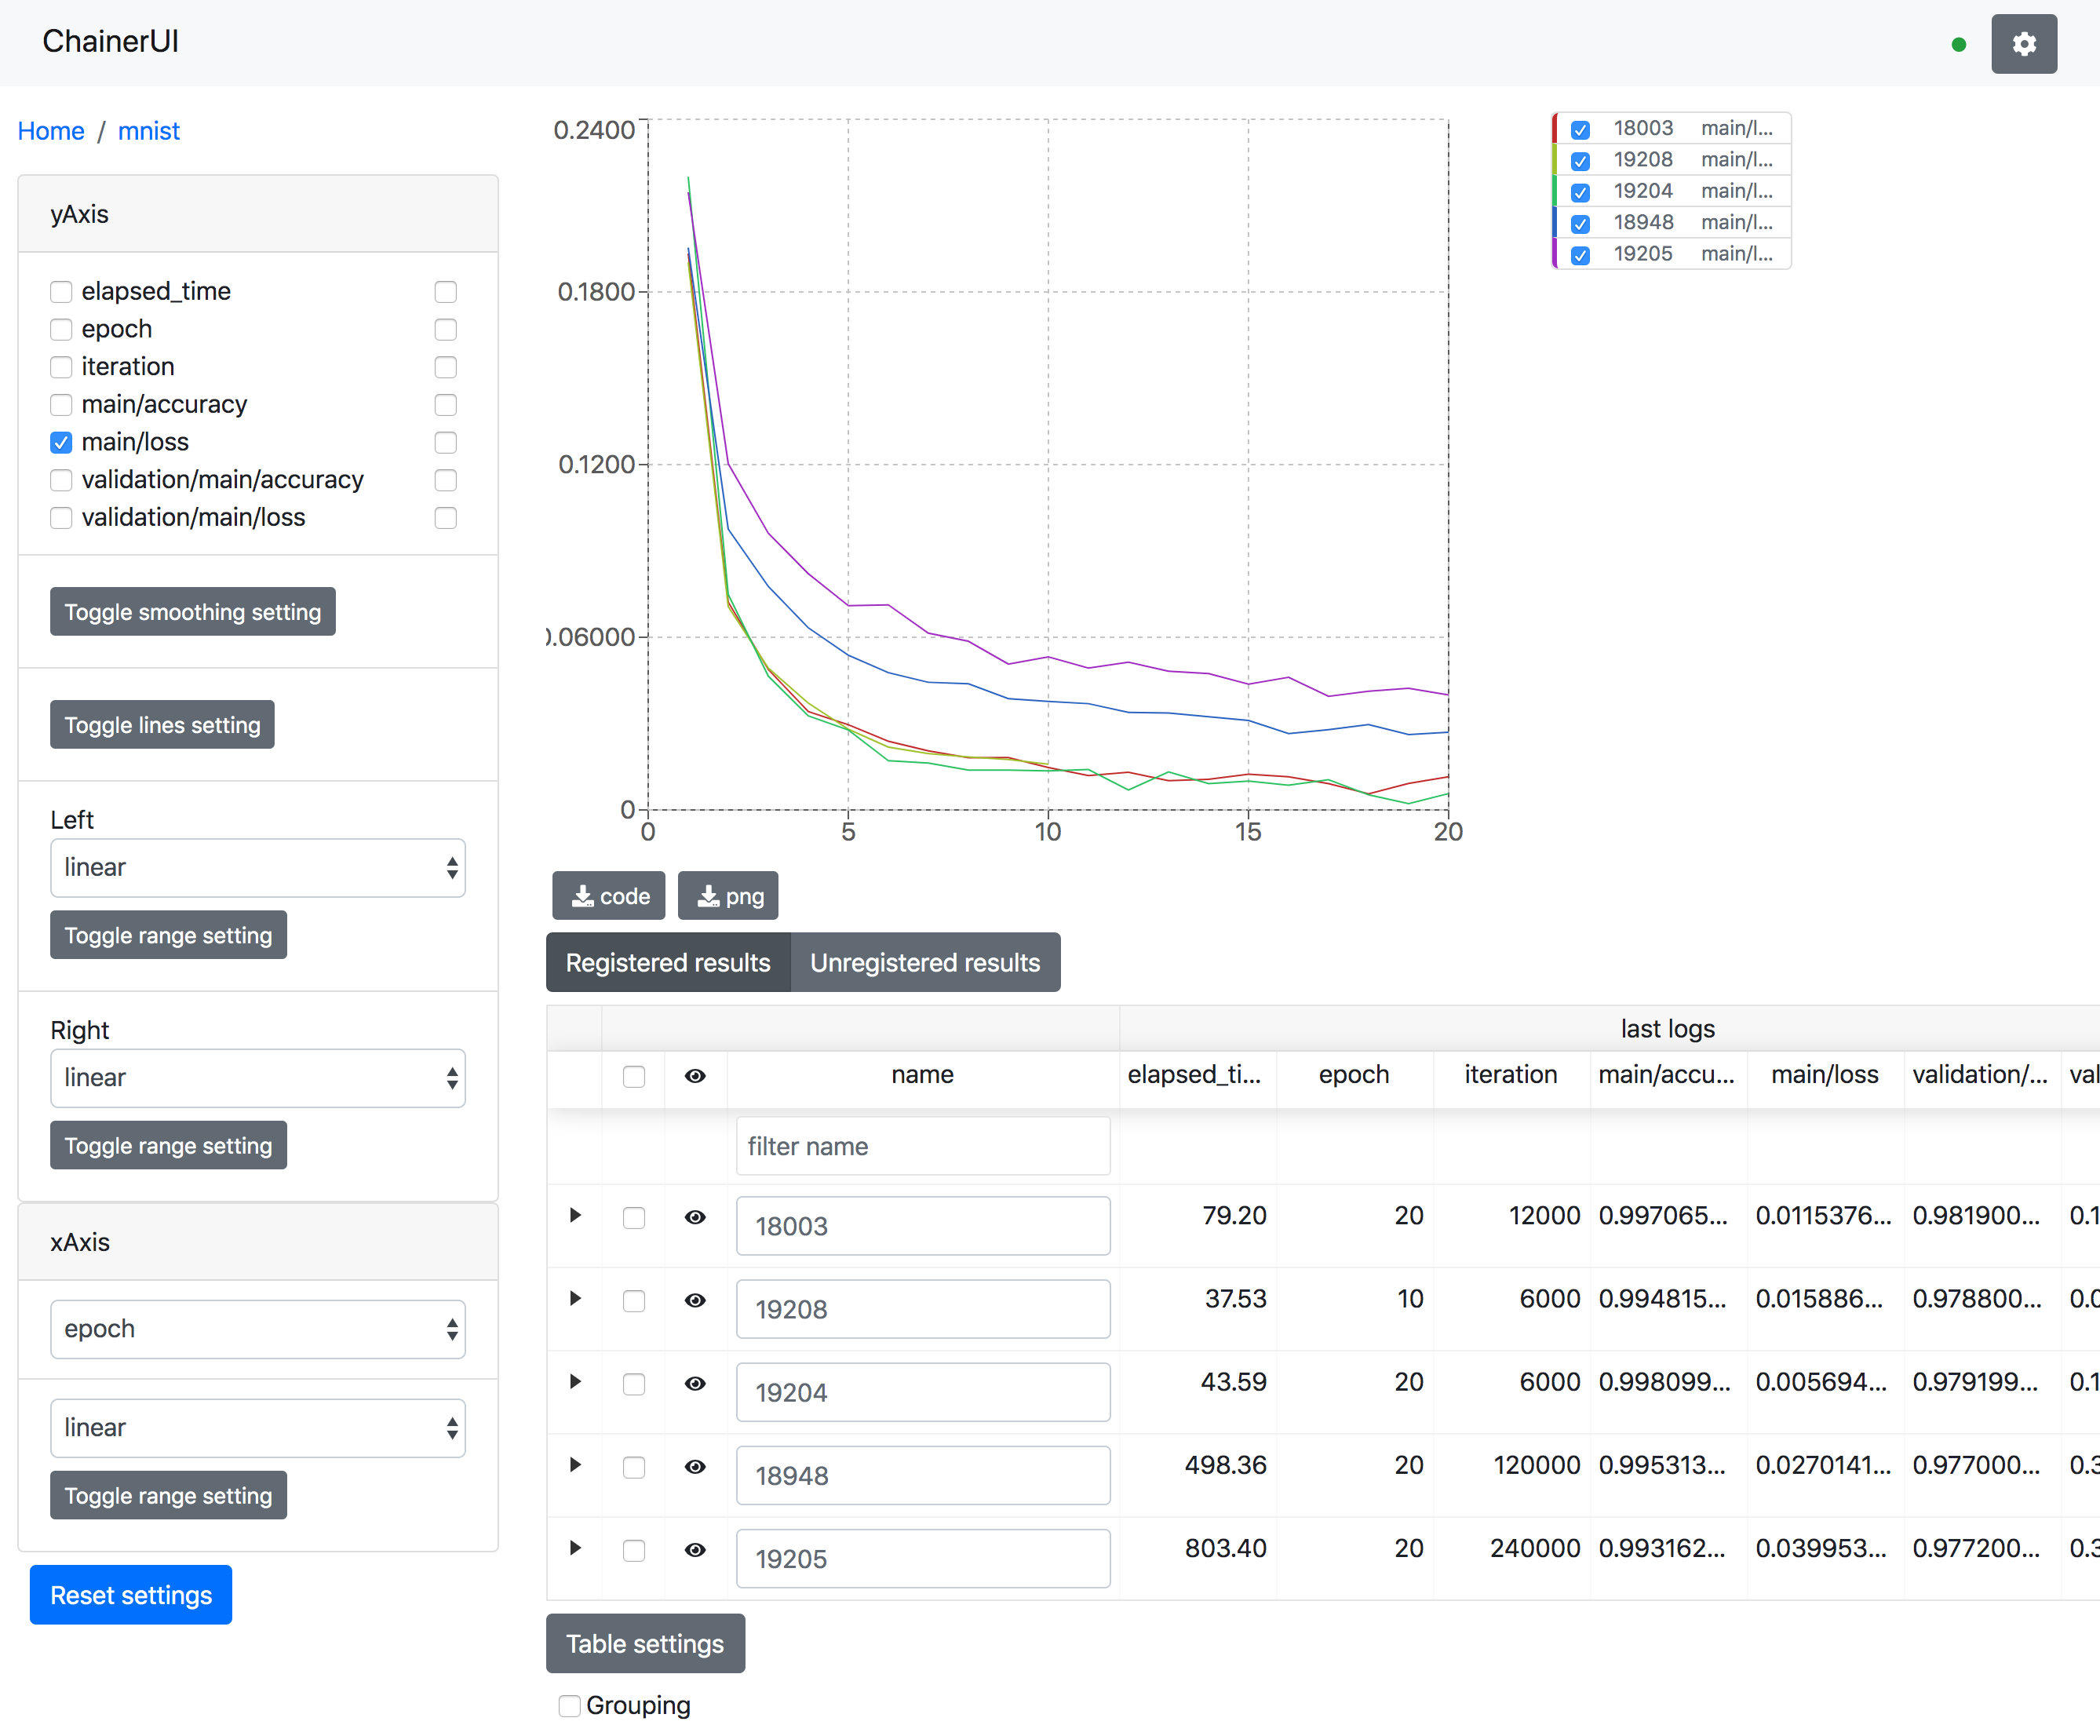
Show training logs and experimental conditions.
Select X-axis value by
xAxispane.epoch,iteration,episode,stepandelapsed_timeare assumed as x-axis.- Drop-down list shows only keys existed in
logfiles.
Select values by
yAxispane.- Left checkboxes are visibility of left axis, right ones are right axis.
- Line color is selected automatically. To change color, click a job name or a key name, see Edit a line.
Reset setting button
- Along with axis settings and selected checkboxes, log keys like
main/lossare also cached on browser storage. The reset button restores cached key, too.
- Along with axis settings and selected checkboxes, log keys like
Save log chart
PNG: Save log chart as PNGCode: Download Python script. Run the downloaded script then get a chart image using Matplotlib. Lines plotted or not are followed by configuration on Web UI. The script has all log data as JSON.
Highlighting
This animation is captured on v0.7.0
Result table and a log chart are linked each other. A selected result is highlighting for emphasis.
Smoothing
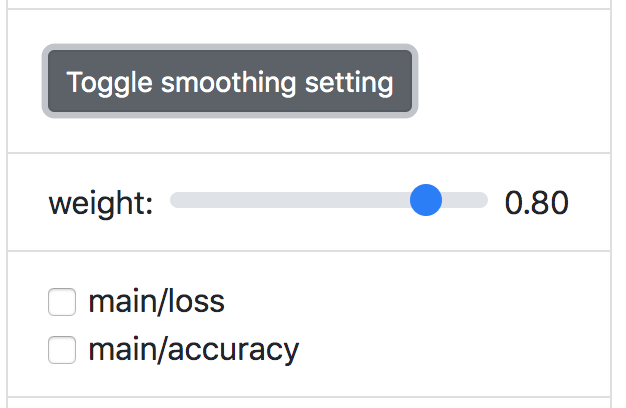
Add smoothing line to help desplaying the overall of trend. Exponential smoothing is used.
Edit a line
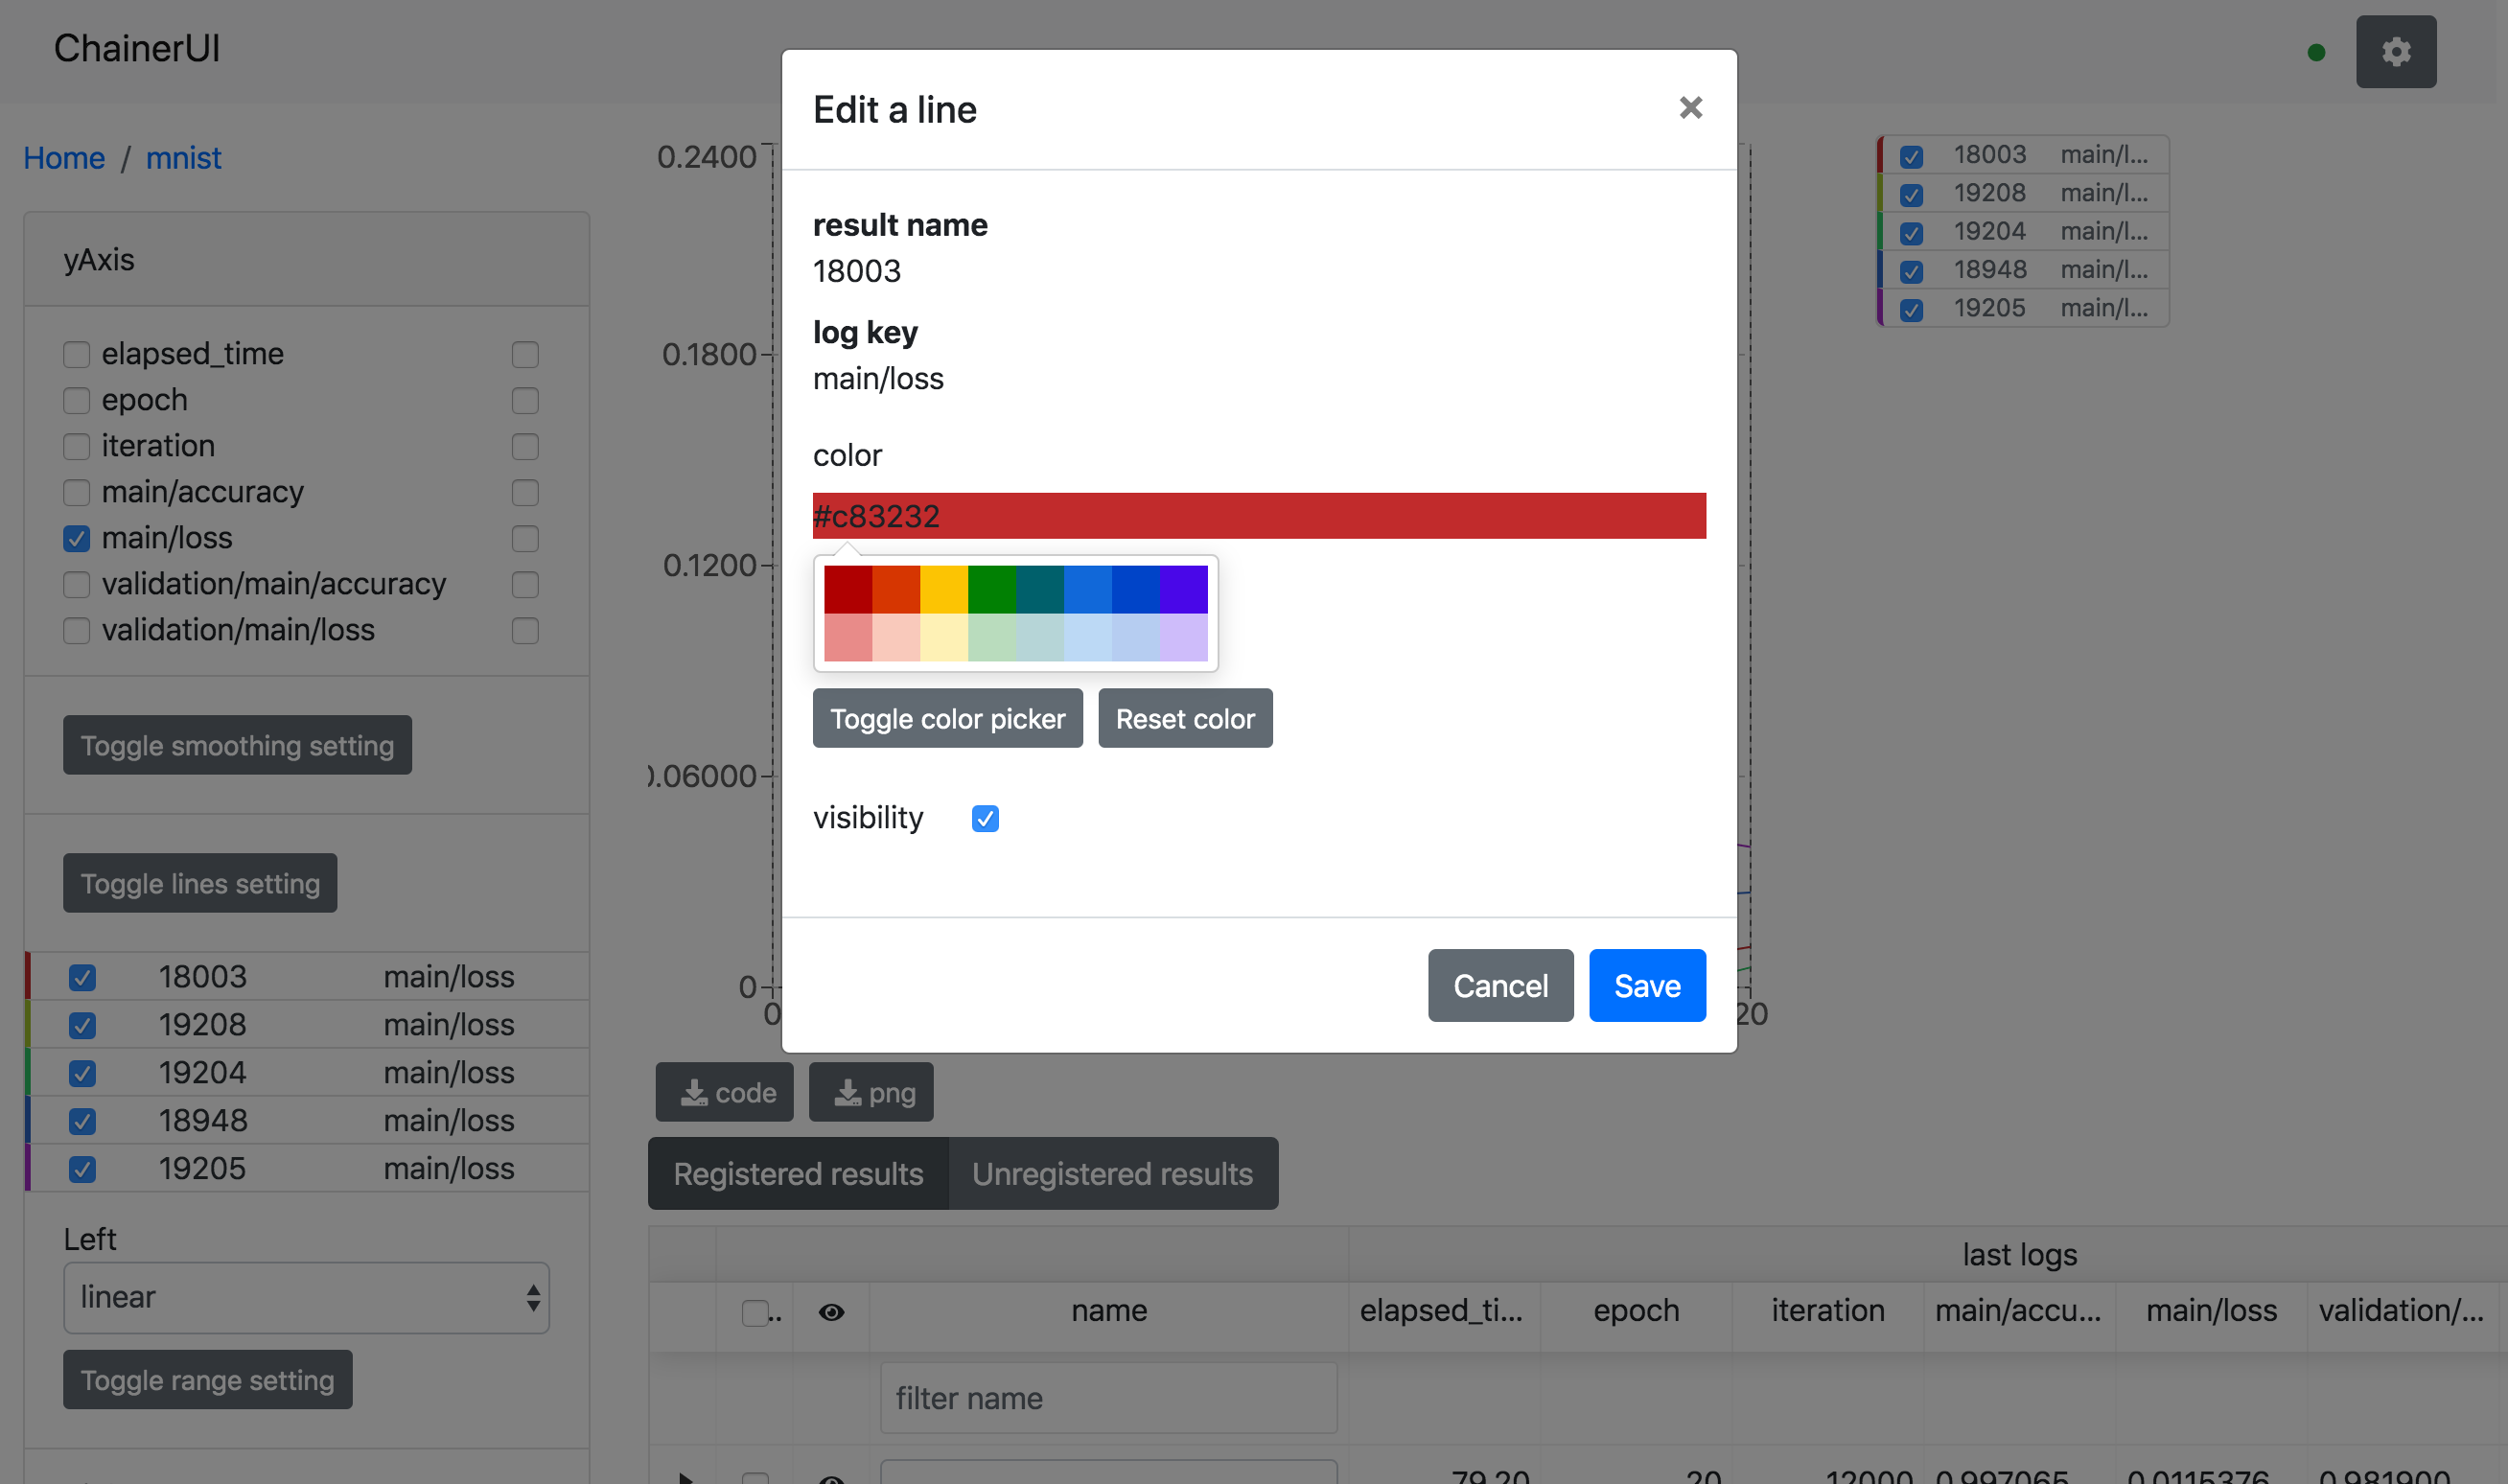
Show detail information about the line, and enable to change the line color. To show this modal, click Toggle lines setting > a job name or a key name on yAxis.
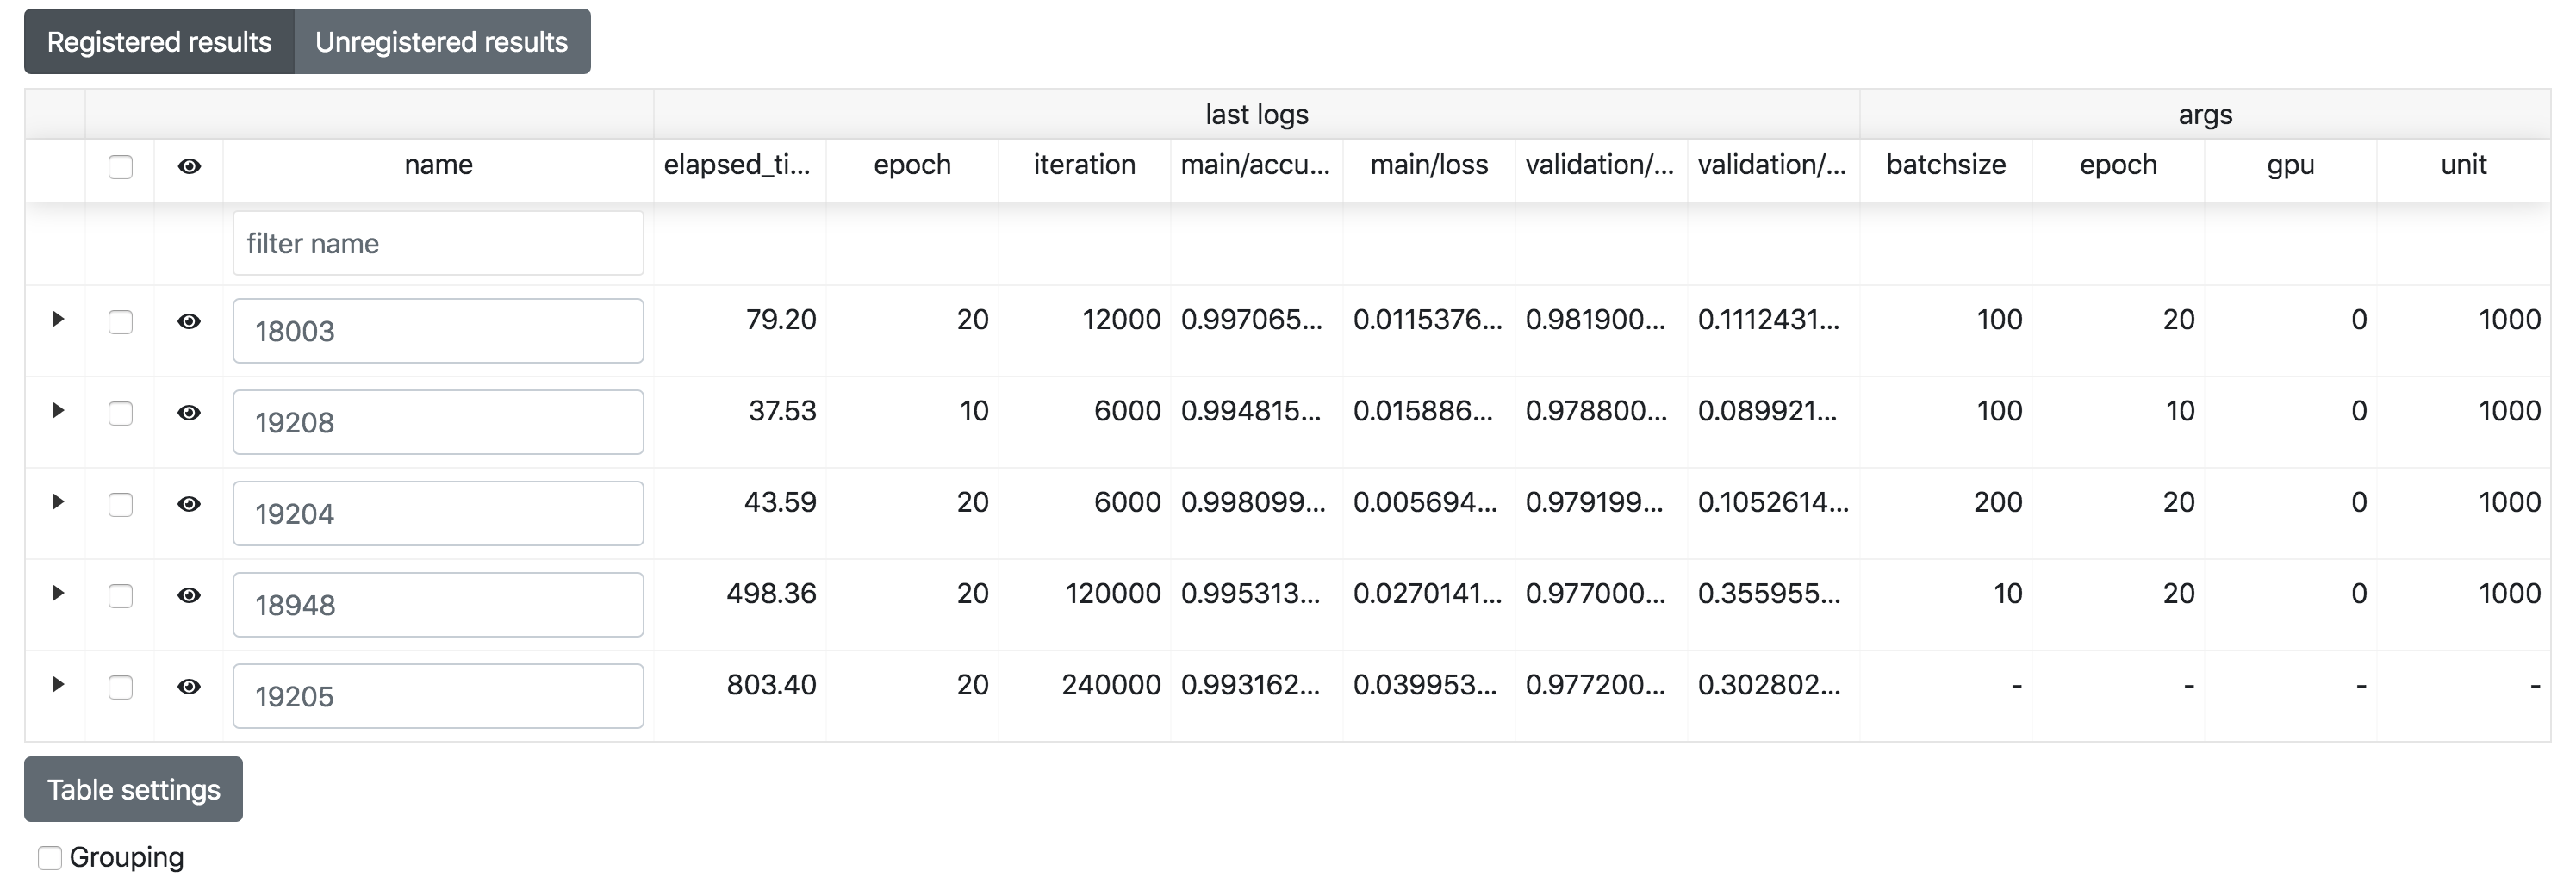
Training job table
expanded the second row to show sub components.
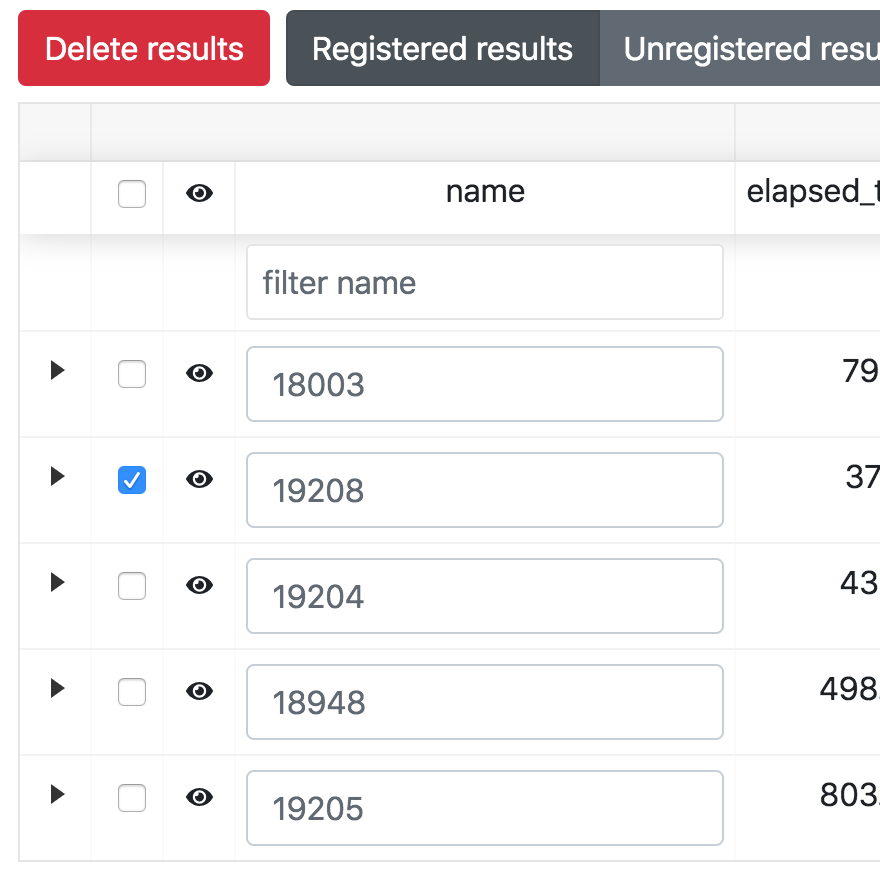
The training job table shows brief log information and experimental conditions. Job names are set to the directory name by default. The name can be edit directly on the table. To unregister a result, click Unregister button in the expanded row. Expanded row has some operation buttons. These buttons operate similarly to buttons in Commands pane.
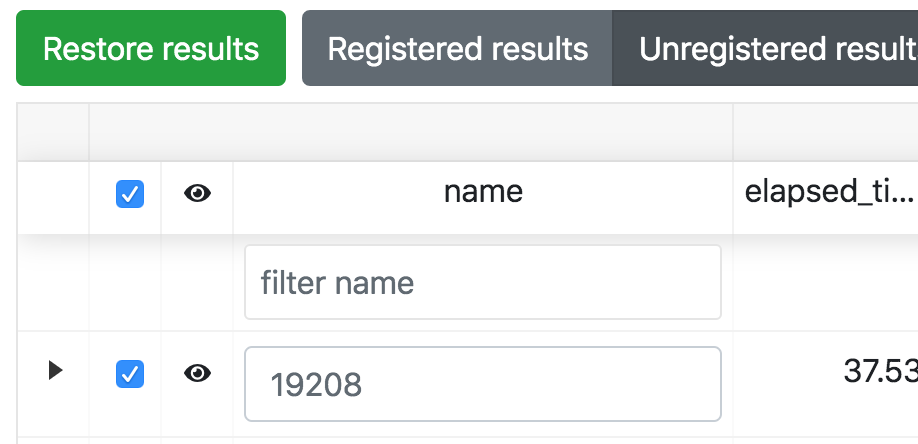
Registered results/Unregistered results: These buttons behavior as tab. When need to show unregistered results, selectUnregistered resulttab to show them.Delete results: When remove results from the result table, check and clickDelete resultbutton. Deleted resutls are showed onUnregistered resultstab.Restore results: When restore deleted result, check the target results onUnregistered resultstab and clickRestore resultsbutton. Restored results are showed again onRegistered resultstab.
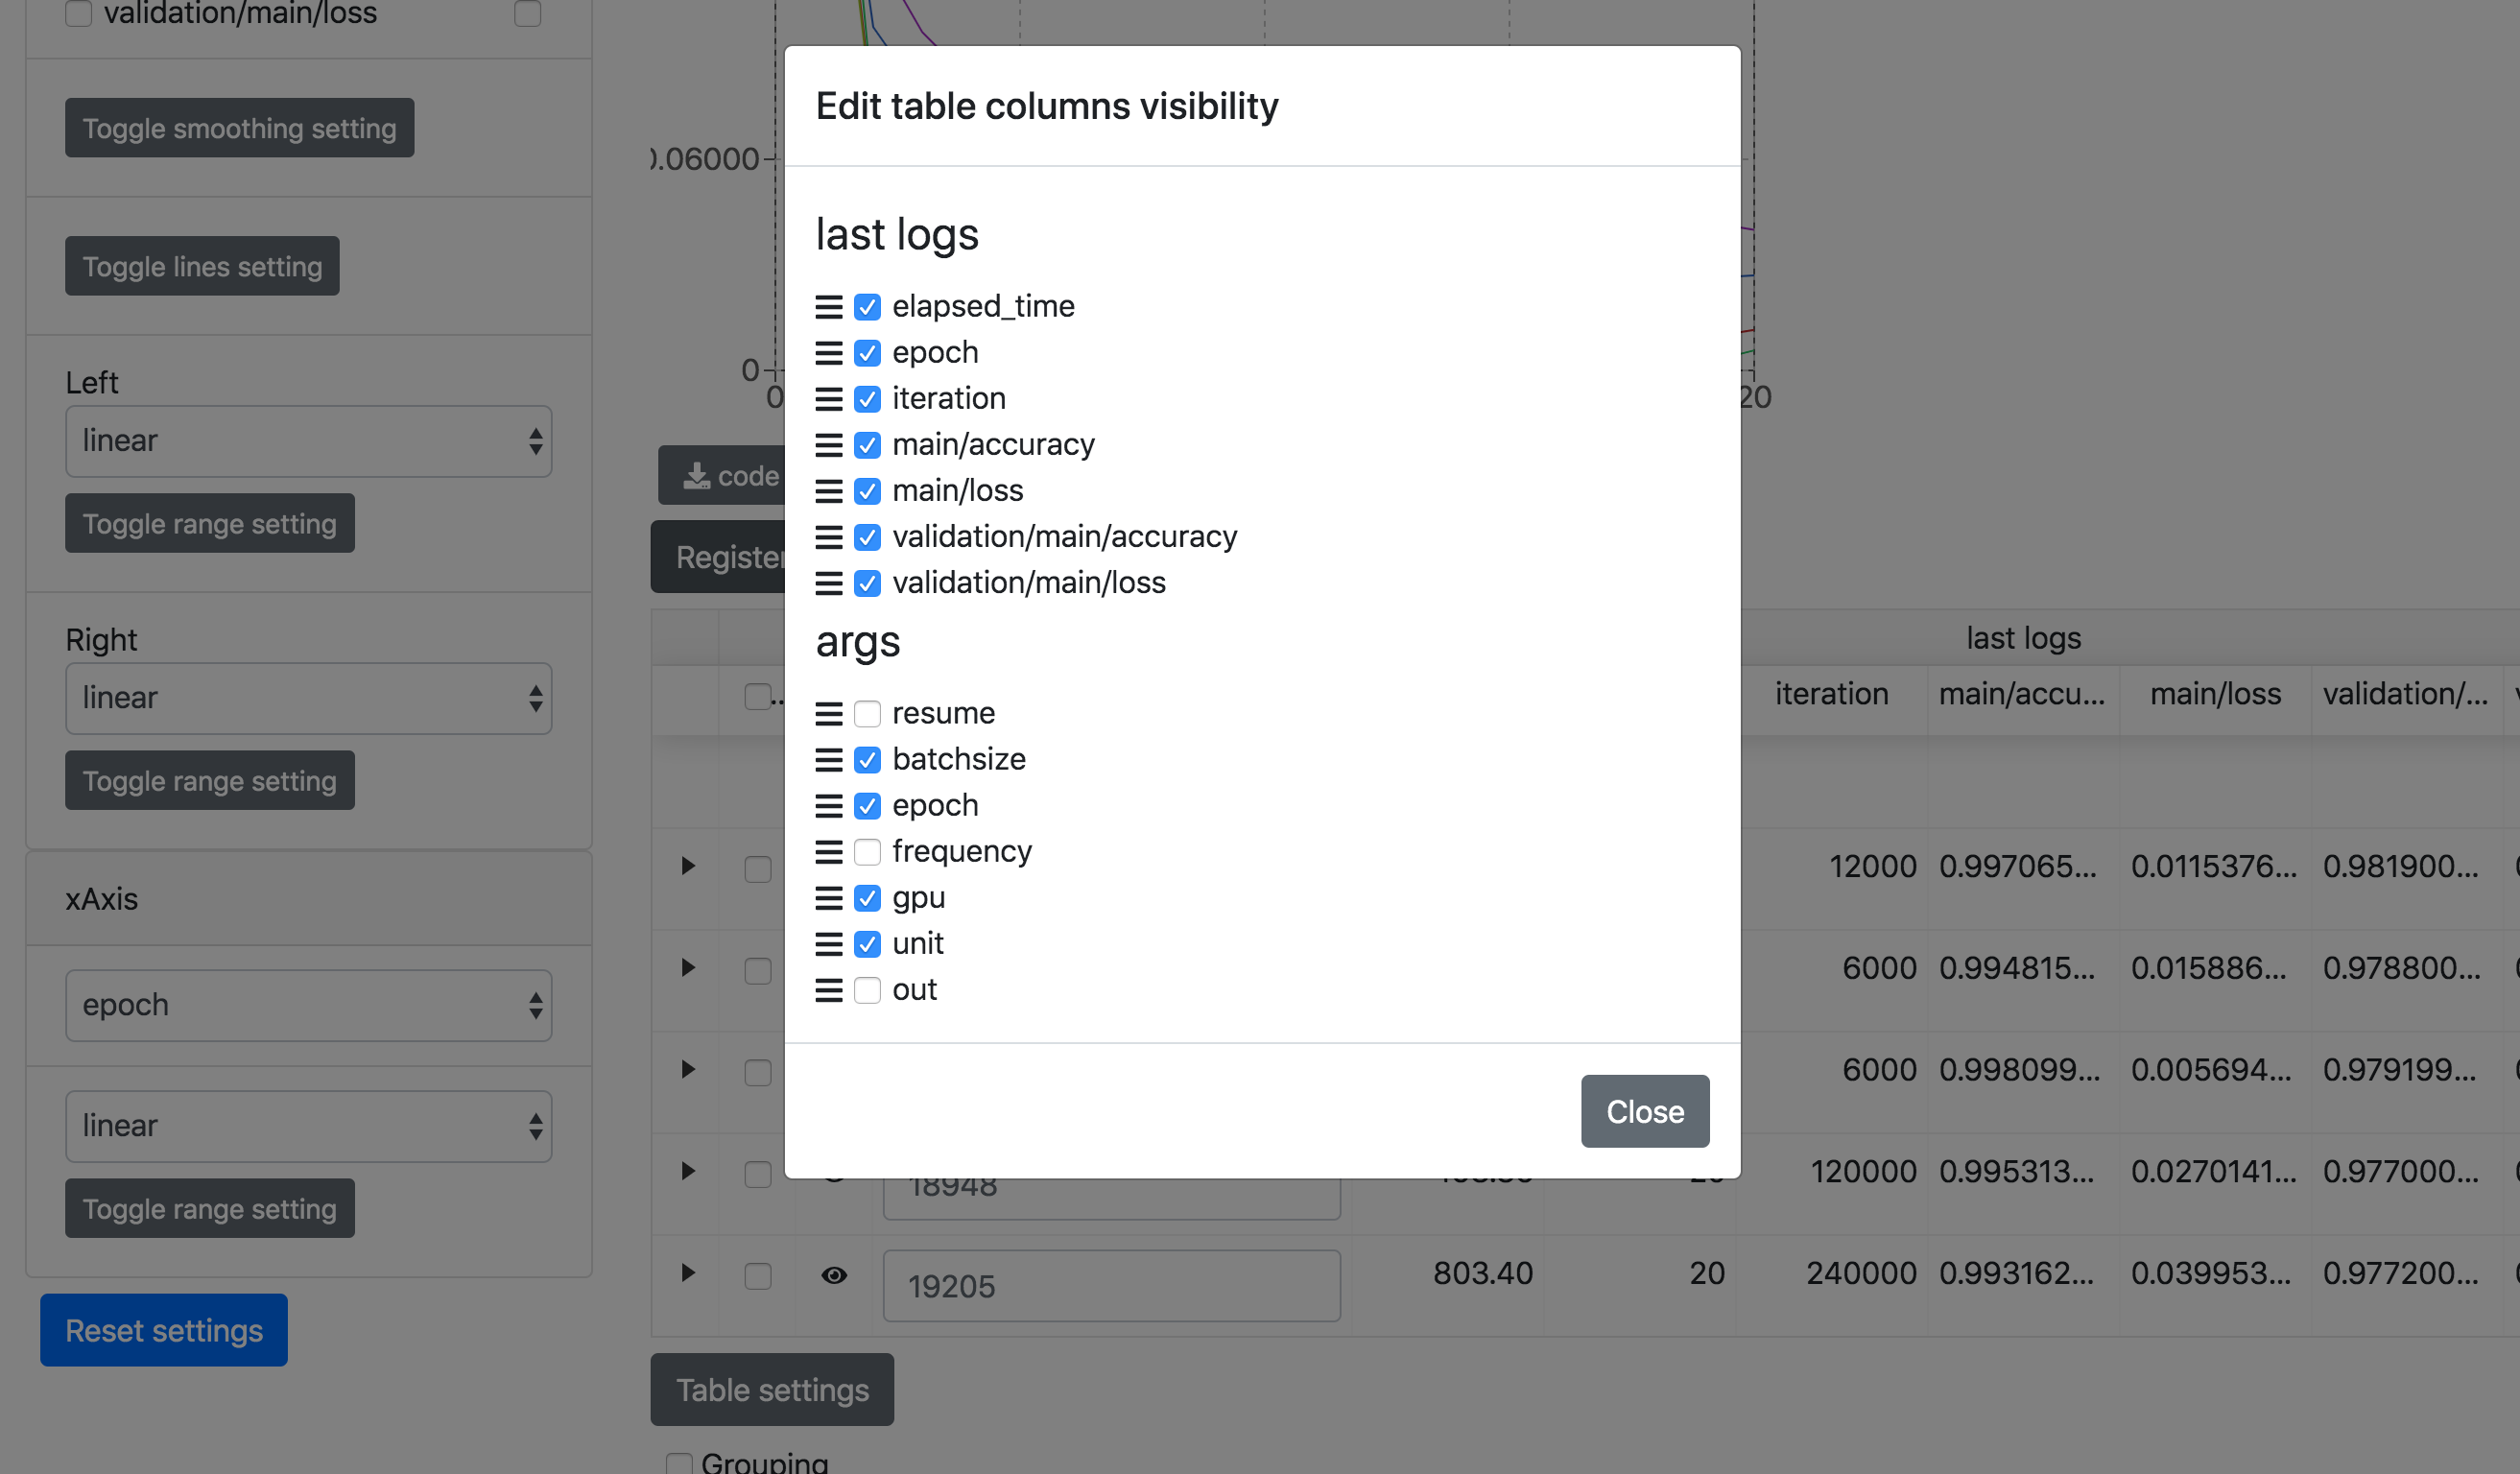
filter name: Filter results by text.Grouping: Group results by grandparent directory.Table Settings: Customize visibility and order of table columns.
Result: Show detailed information of the results
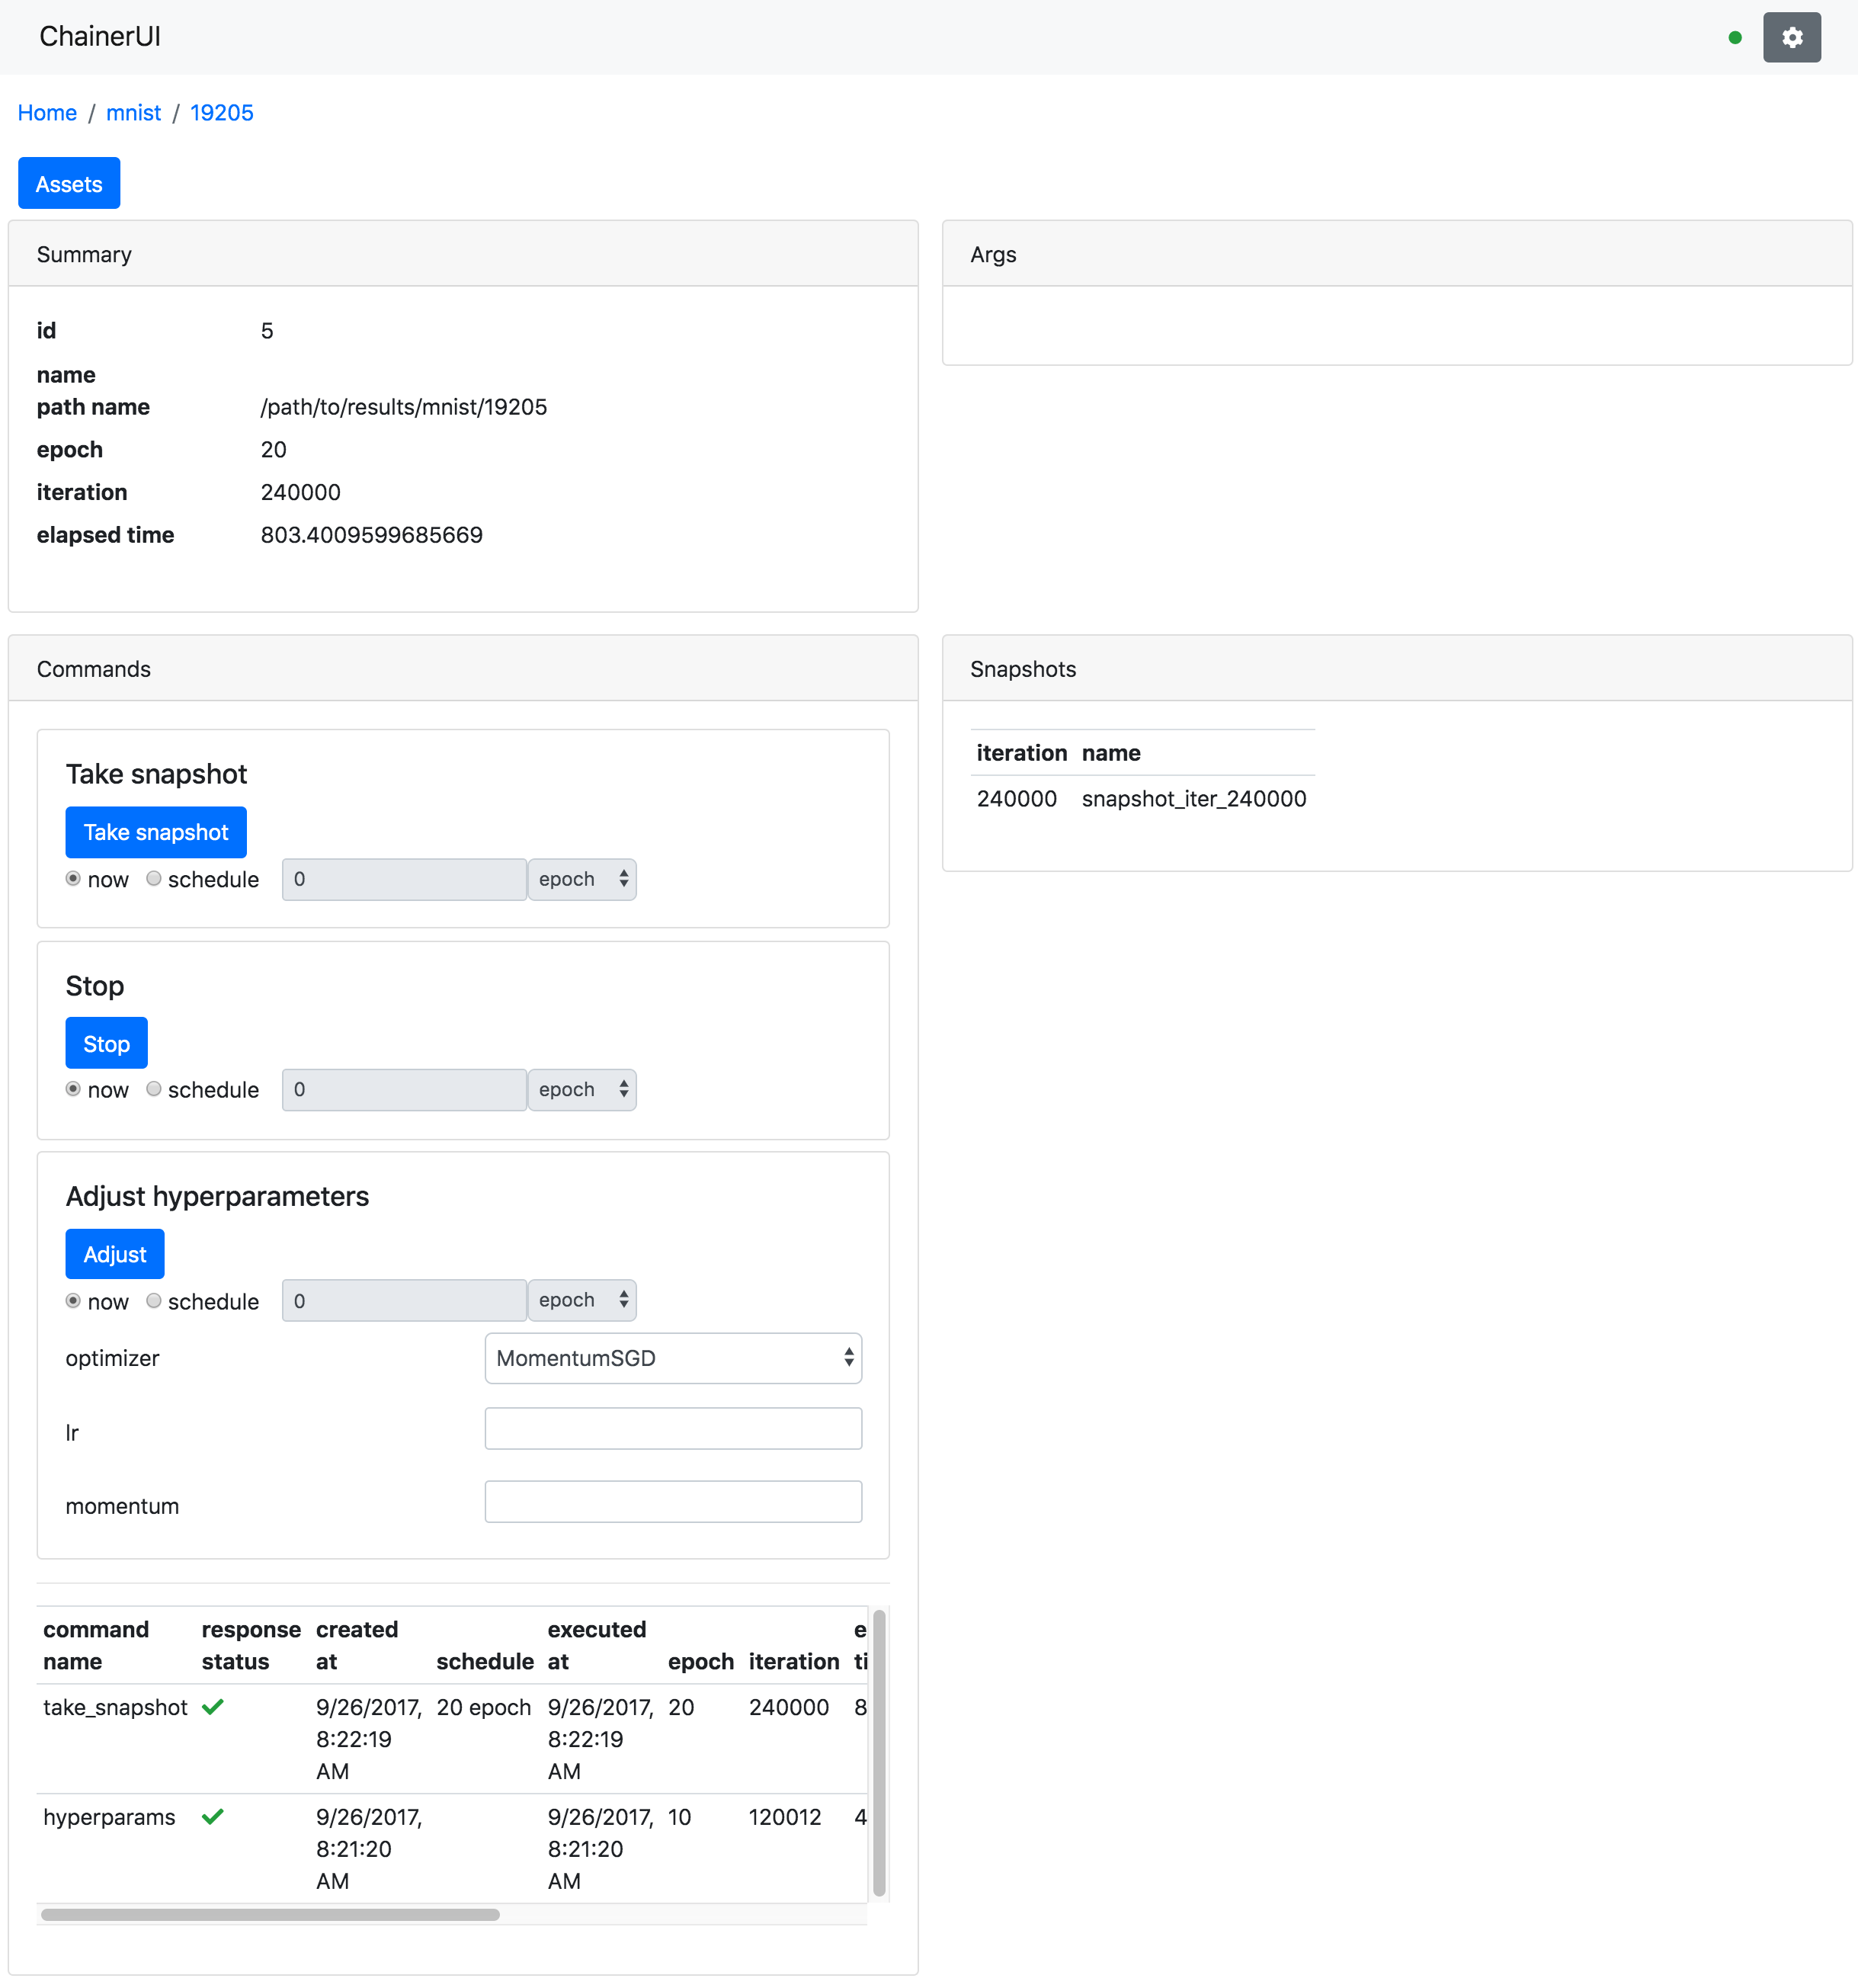
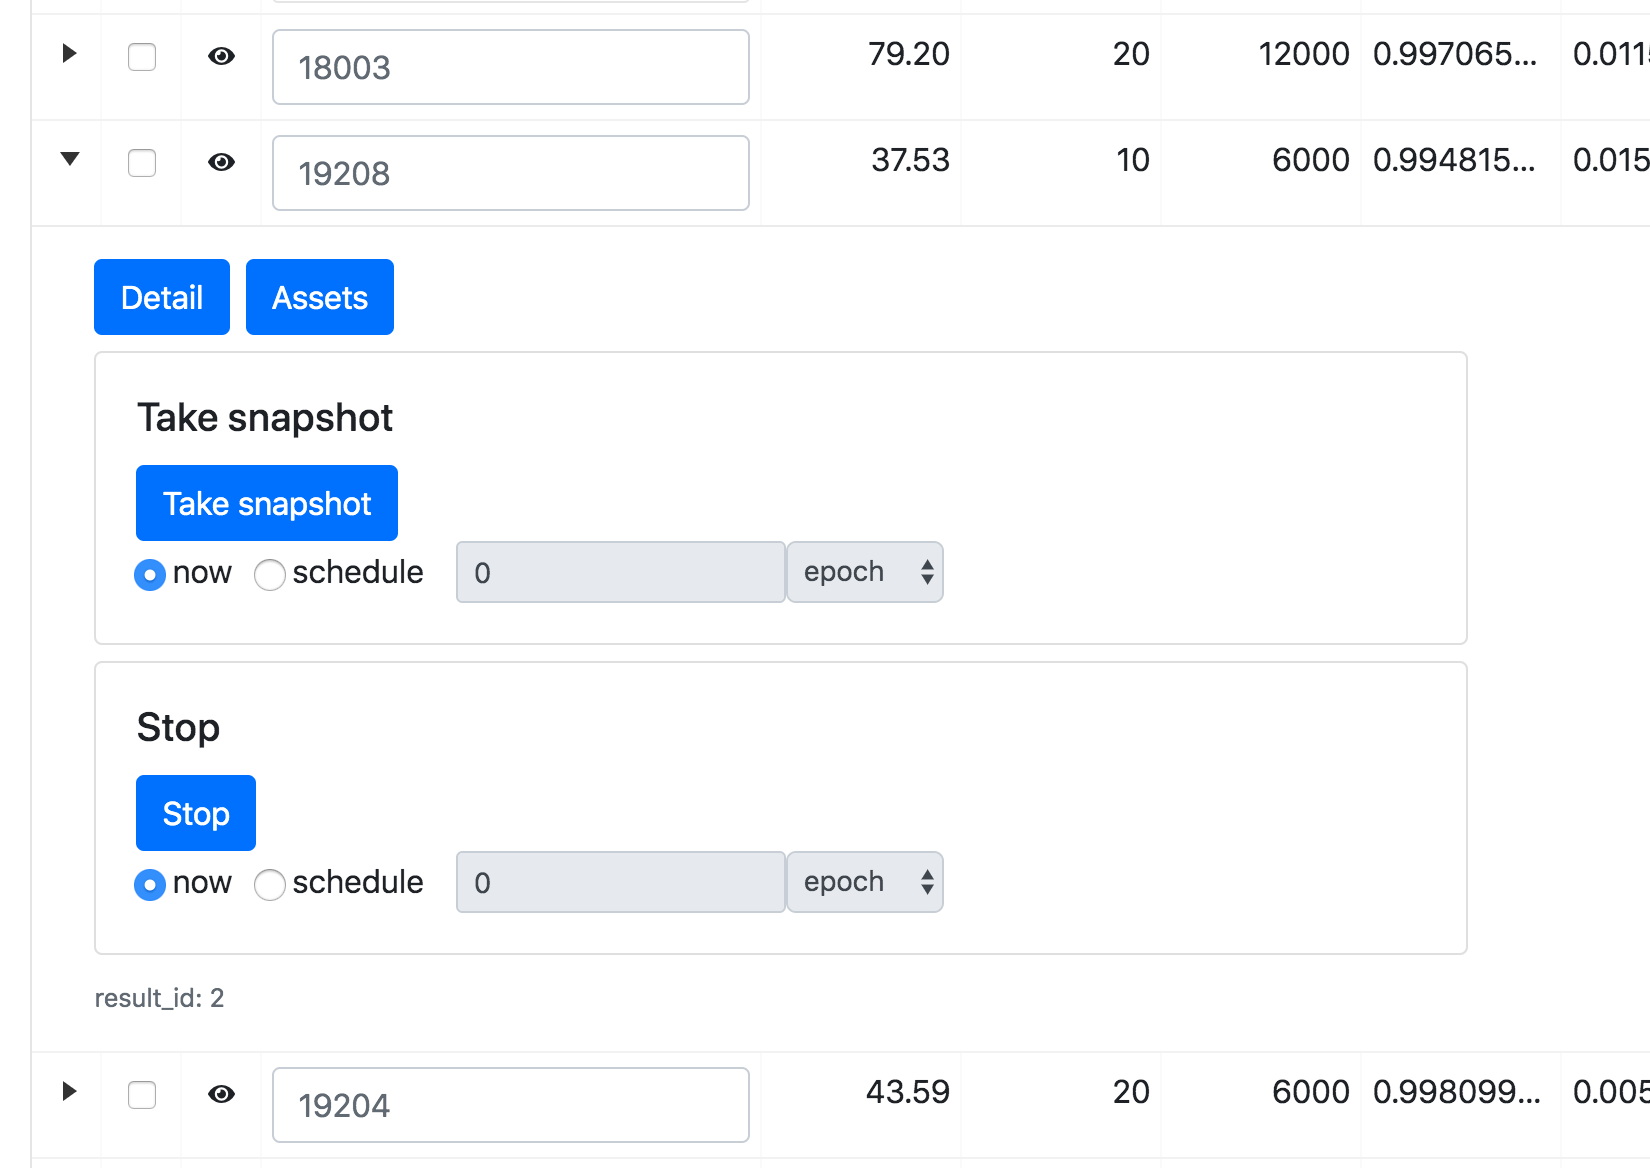
Show detailed information of the training job and support operation of the training loop.
Commands pane
Operation buttons in Commands pane allow users to operate the training job. To enable these buttons, the trining job is required to set CommandsExtension and click them within running the job. For more detail of how to set the extension, see Operate training loop.
Take snapshot
Save a training model to the file in NPZ format with using save_napz By default, snapshot_iter_{.updater.iteration} file is saved to the result path.
Stop
Stop the trining loop.
Adjust
Adjust the hyperparameters of an optimizer. This function supports only MomentumSGD optimizer.
Command history
The command history is shown on the down of the pane.