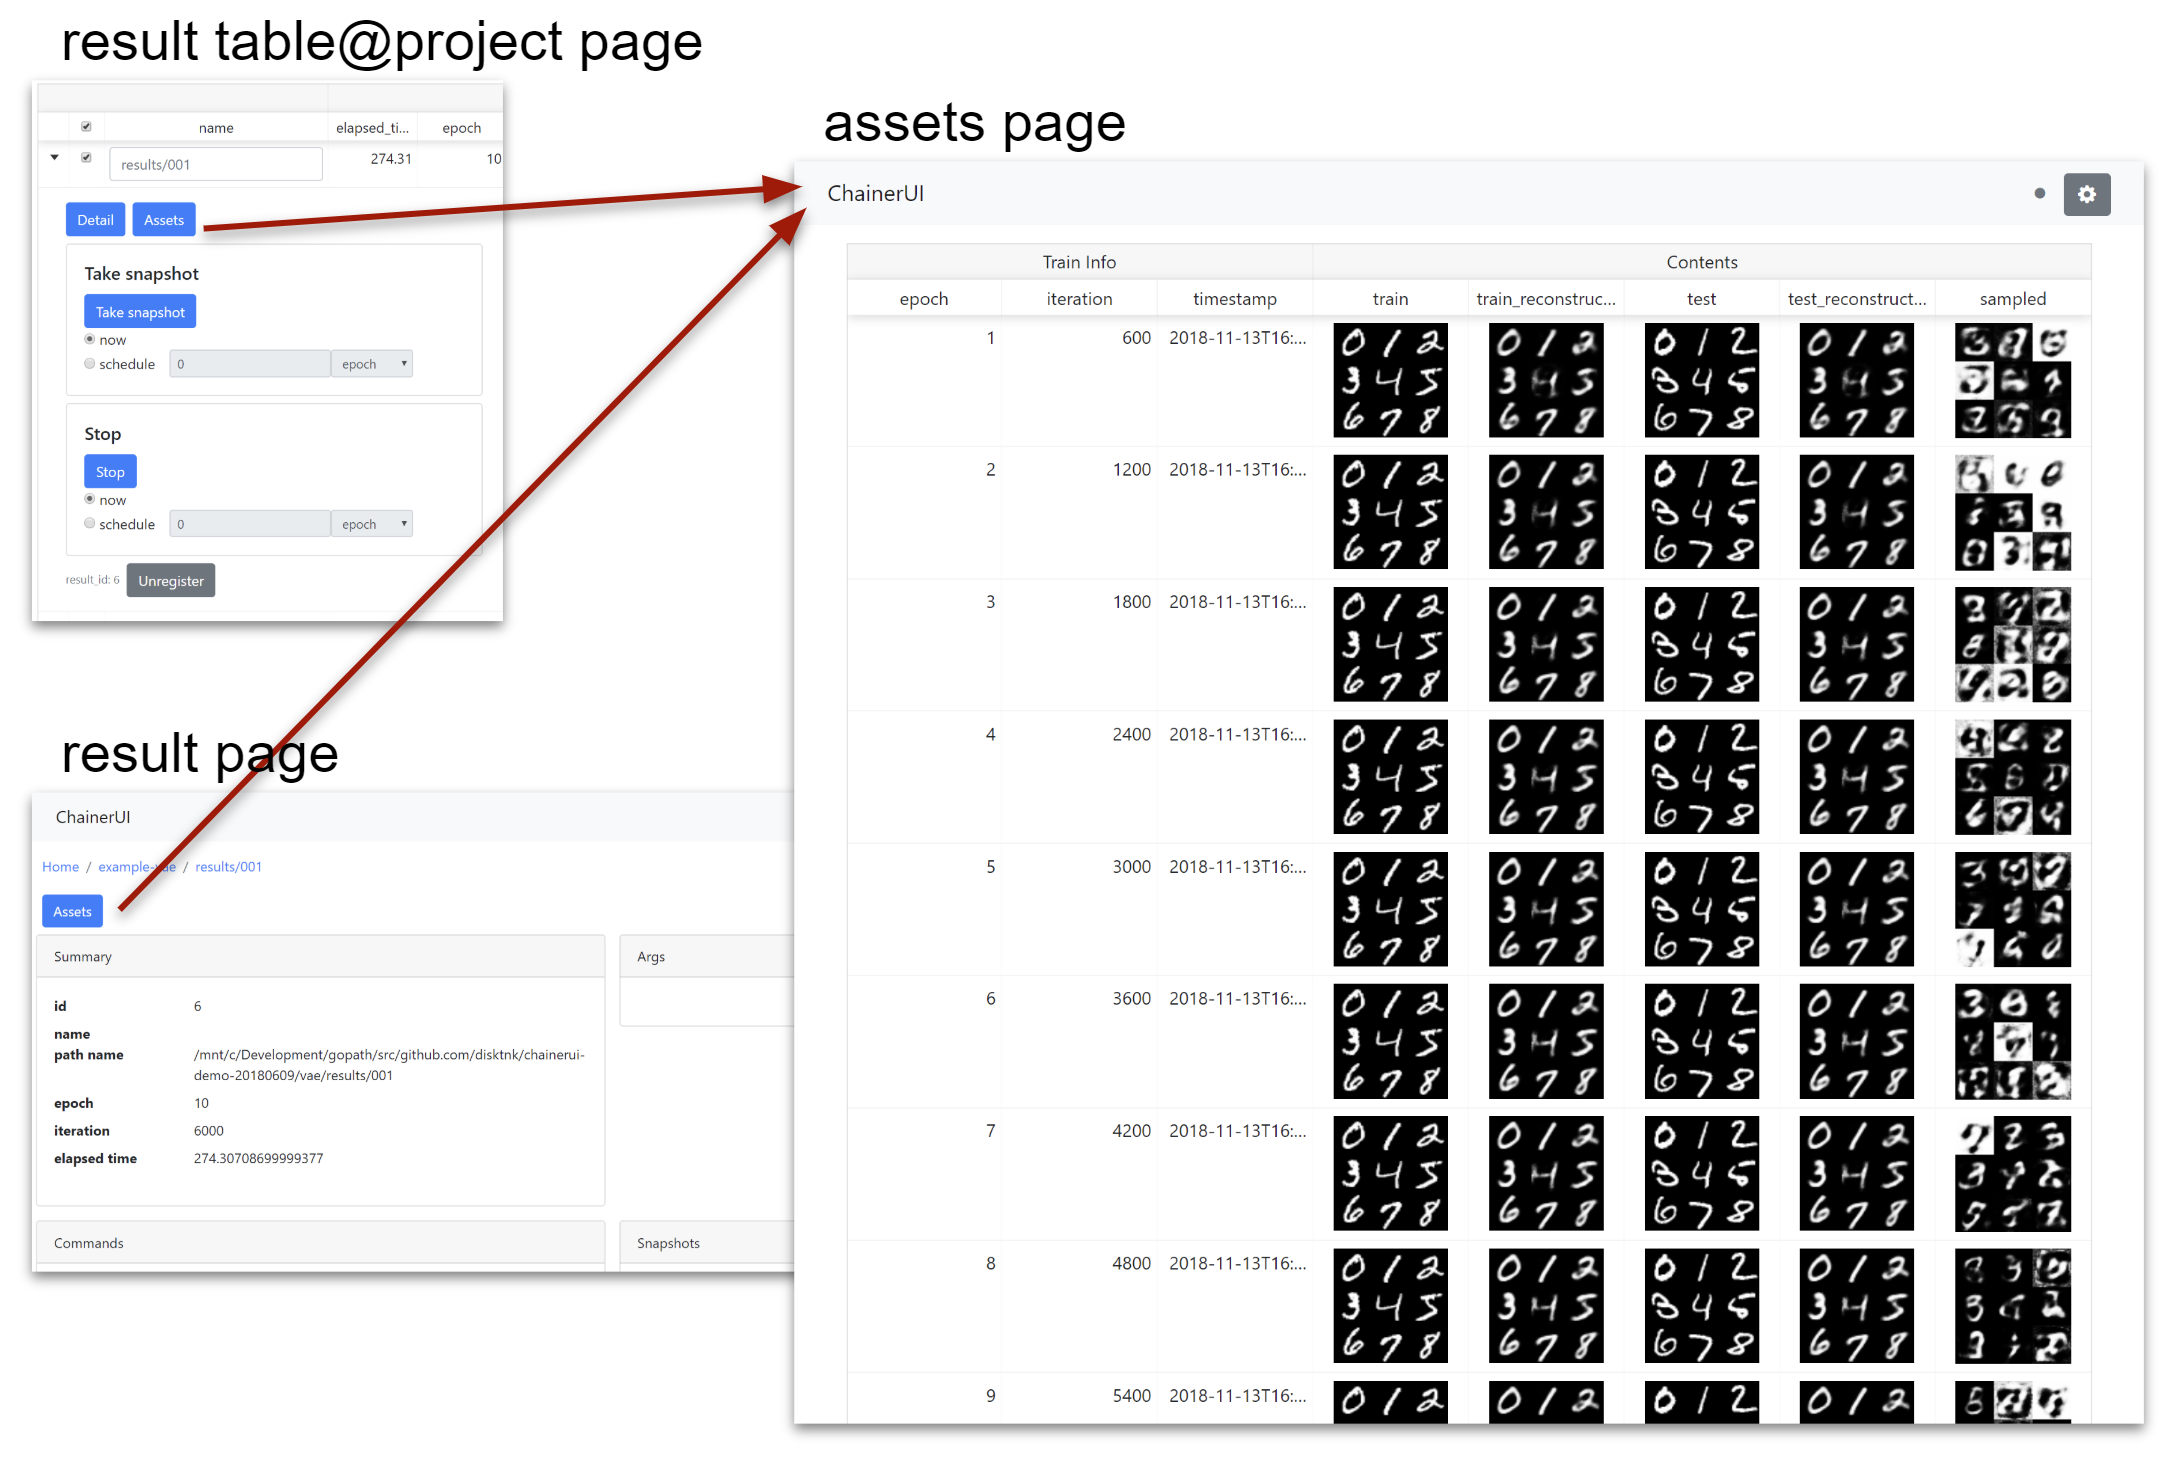
Visualize assets
ChainerUI provides /assets endpoint from v0.8.0 to visualize media assets such image or audio. Basically by using Asset summaries module, functions convert ndarray to the specified media type or collect texts, as it turns out to show them on a web browser. Assets page can be seen from assets button on result table or result detail.
Note
chainerui.summary module requires output directory path. The path must be same as the directory put log file to gather media assets as experimental result. The log file is created by LogReport extension or chainerui’s LogReport.
from chainer import training
from chainerui import summary

out_put = '/path/to/result/'
trainer = training.Trainer(updater, out=out_put)
trainer.extend(training.extensions.LogReport())  # log file will be created at `out_put`
summary.set_out(out_put)  # set output directory as global
From next section, example codes are skipped getting assets and set output directory, like blow snippet.
# get color images and grayscale images for example
import chainer
images, _ = chainer.datasets.get_svhn(withlabel=False)
images_gs, _ = chainer.datasets.get_mnist(withlabel=False, ndim=2)

# make dummy audio data for example
import numpy
audio = numpy.random.uniform(-1, 1, 16000)

from chainerui import summary
summary.set_out('/path/to/result')
Use summary function
There are 2 ways to show assets on a web browser. First, use summary module function directly. The below example is a simple code to show images.
summary.image(images[0:5])
summary.image(images[5:10])
summary.audio(audio, 16000)
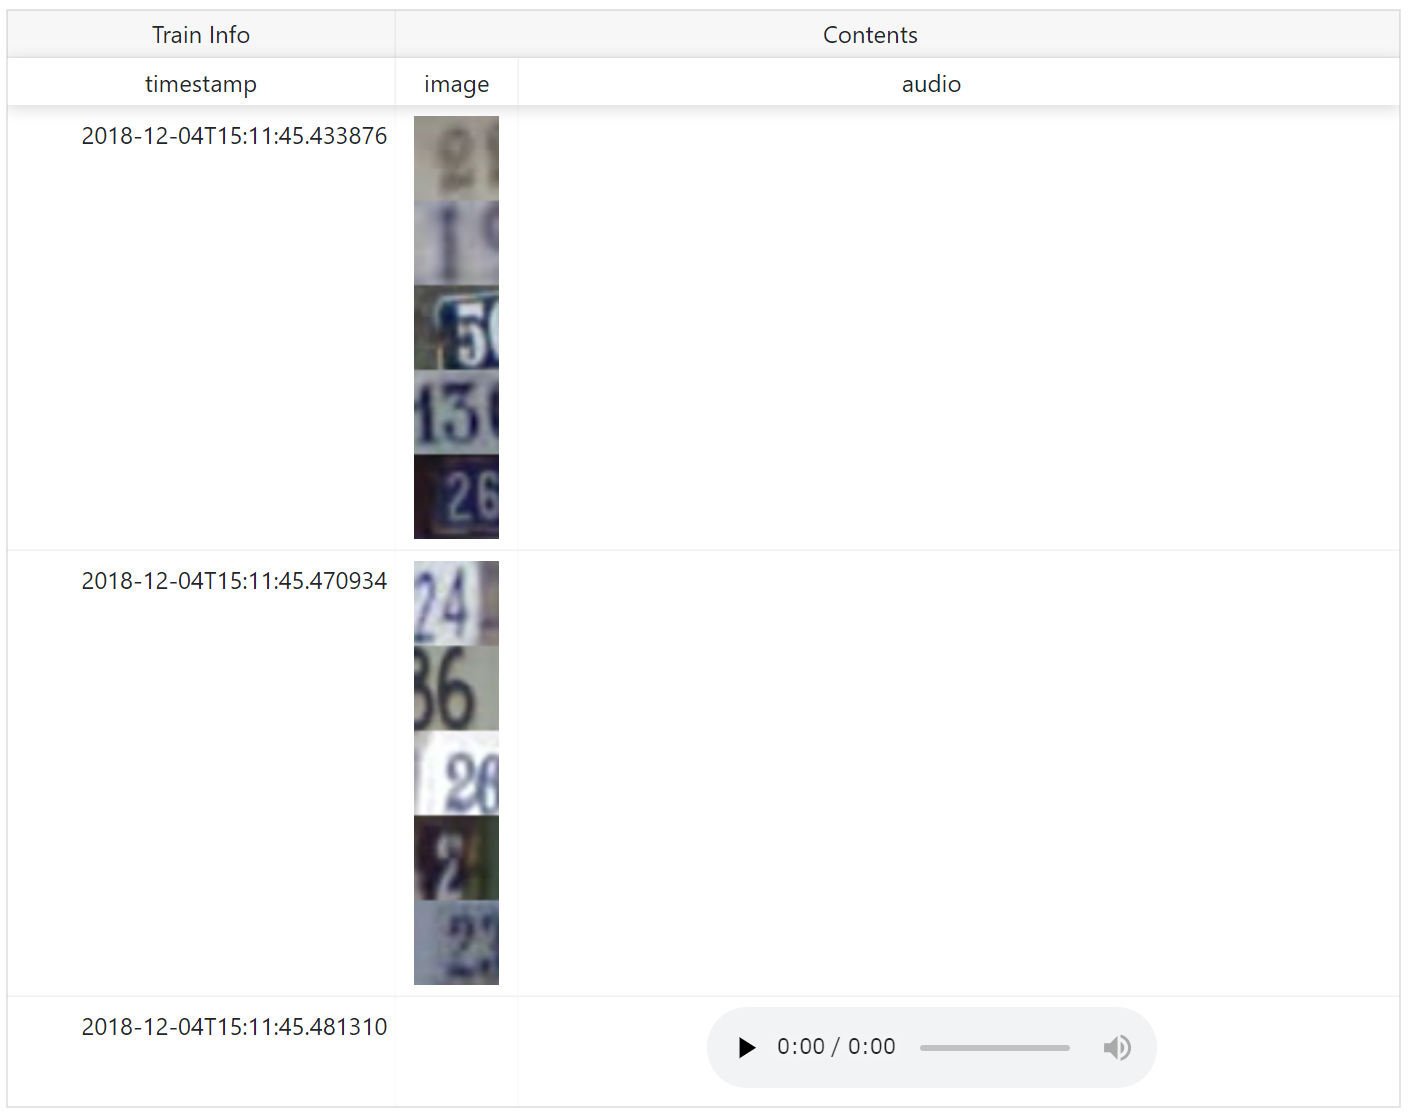
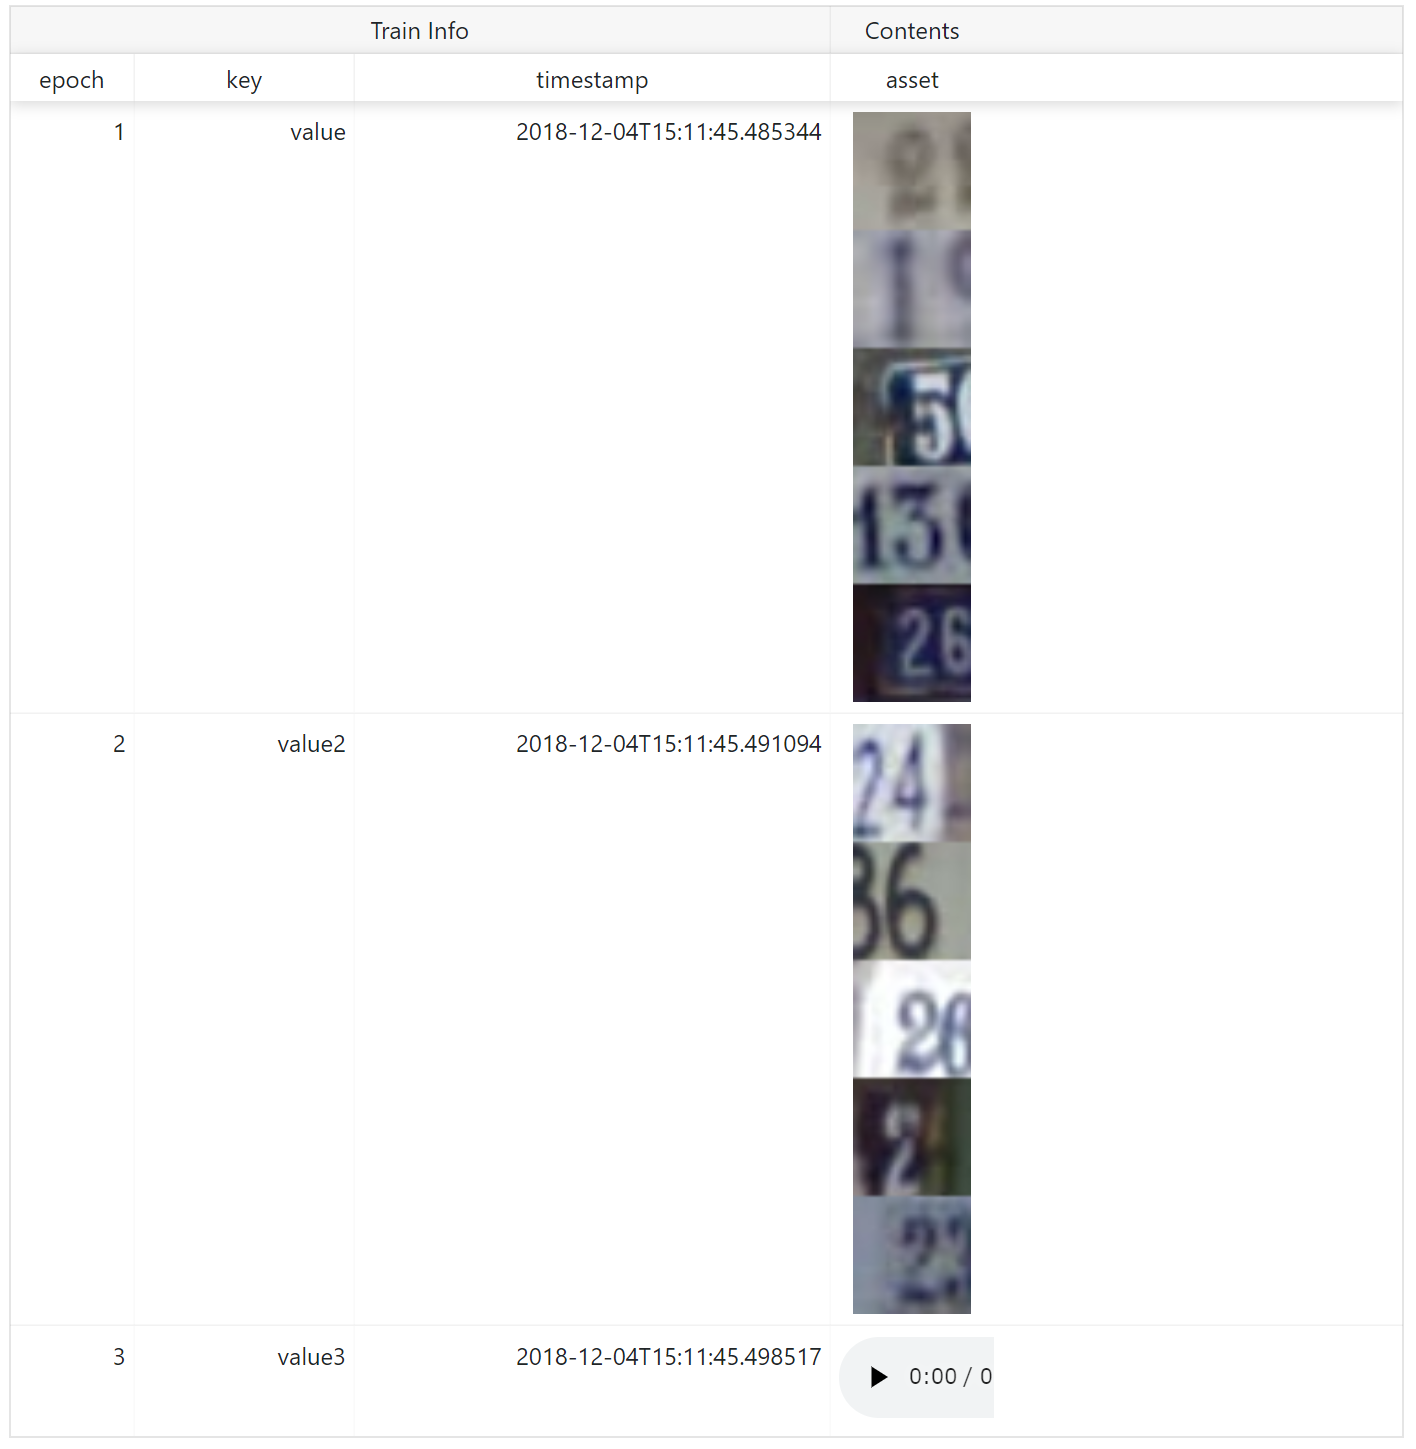
name is shown as column name. When show assets with additional text information such as epoch number, iteration number, descriptions and so on, add them as **kwargs.
summary.image(images[0:5], name='asset', epoch=1, key='value')
summary.image(images[5:10], name='asset', epoch=2, key='value2')
summary.audio(audio, 16000, name='asset', epoch=3, key='value3')
Use reporter function
Second, to aggregate assets to show them in a same row, use reporter function. Assets called under with statement are aggregated.
with summary.reporter() as r:
    r.image(images[0:5])
    r.image(images[5:10])
with summary.reporter() as r:
    r.image(images[10:15])
    r.image(images[15:20])
with summary.reporter() as r:
    r.image(images[20:25])
    r.image(images[25:30])
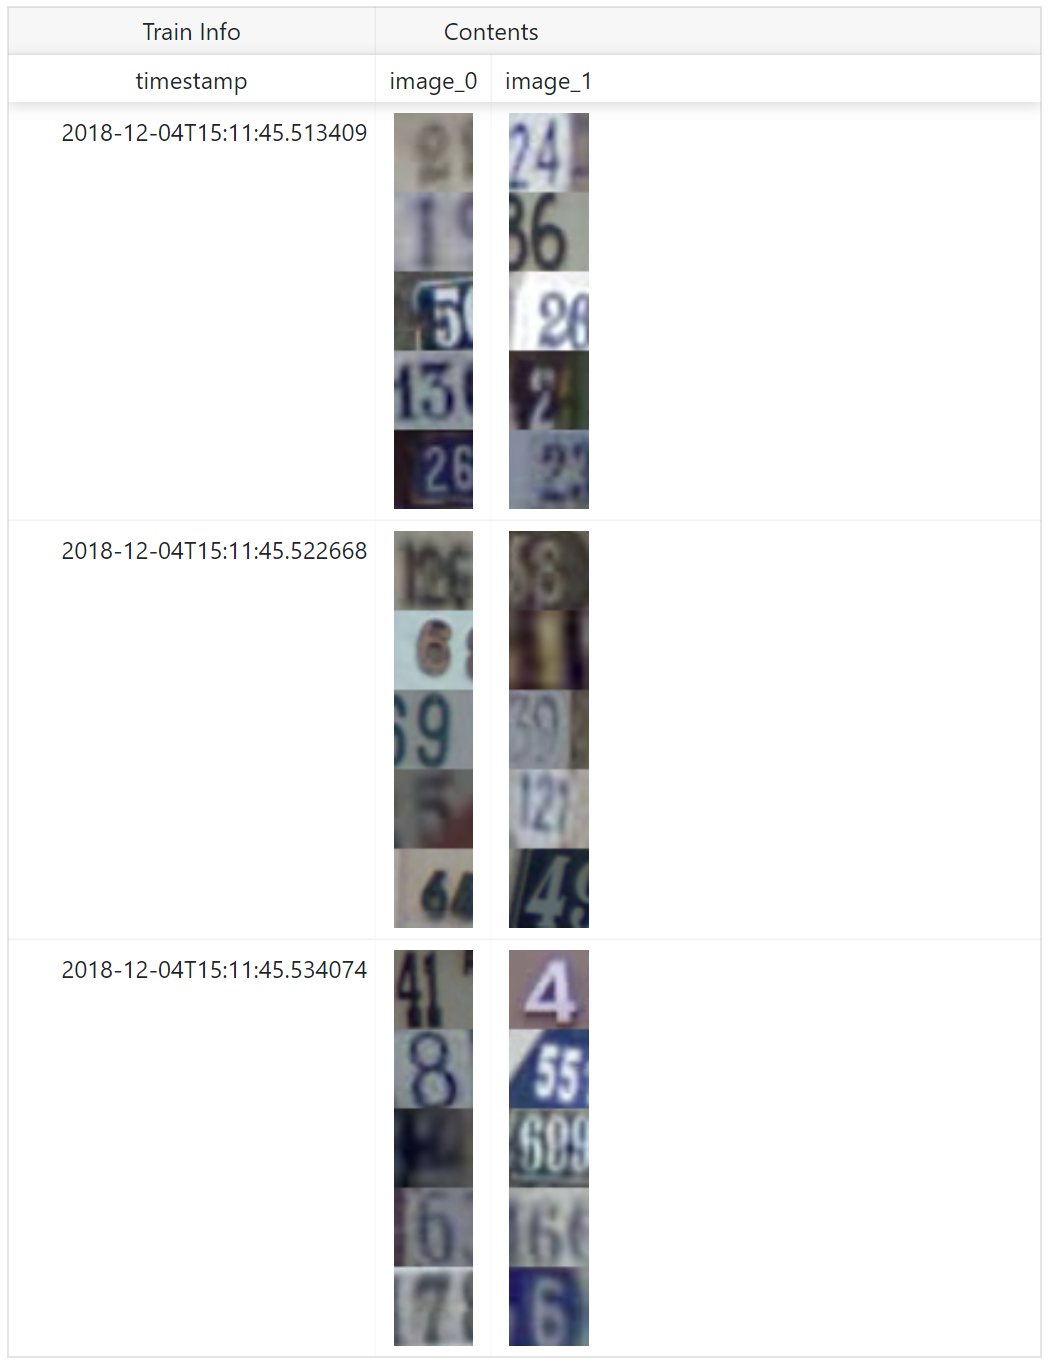
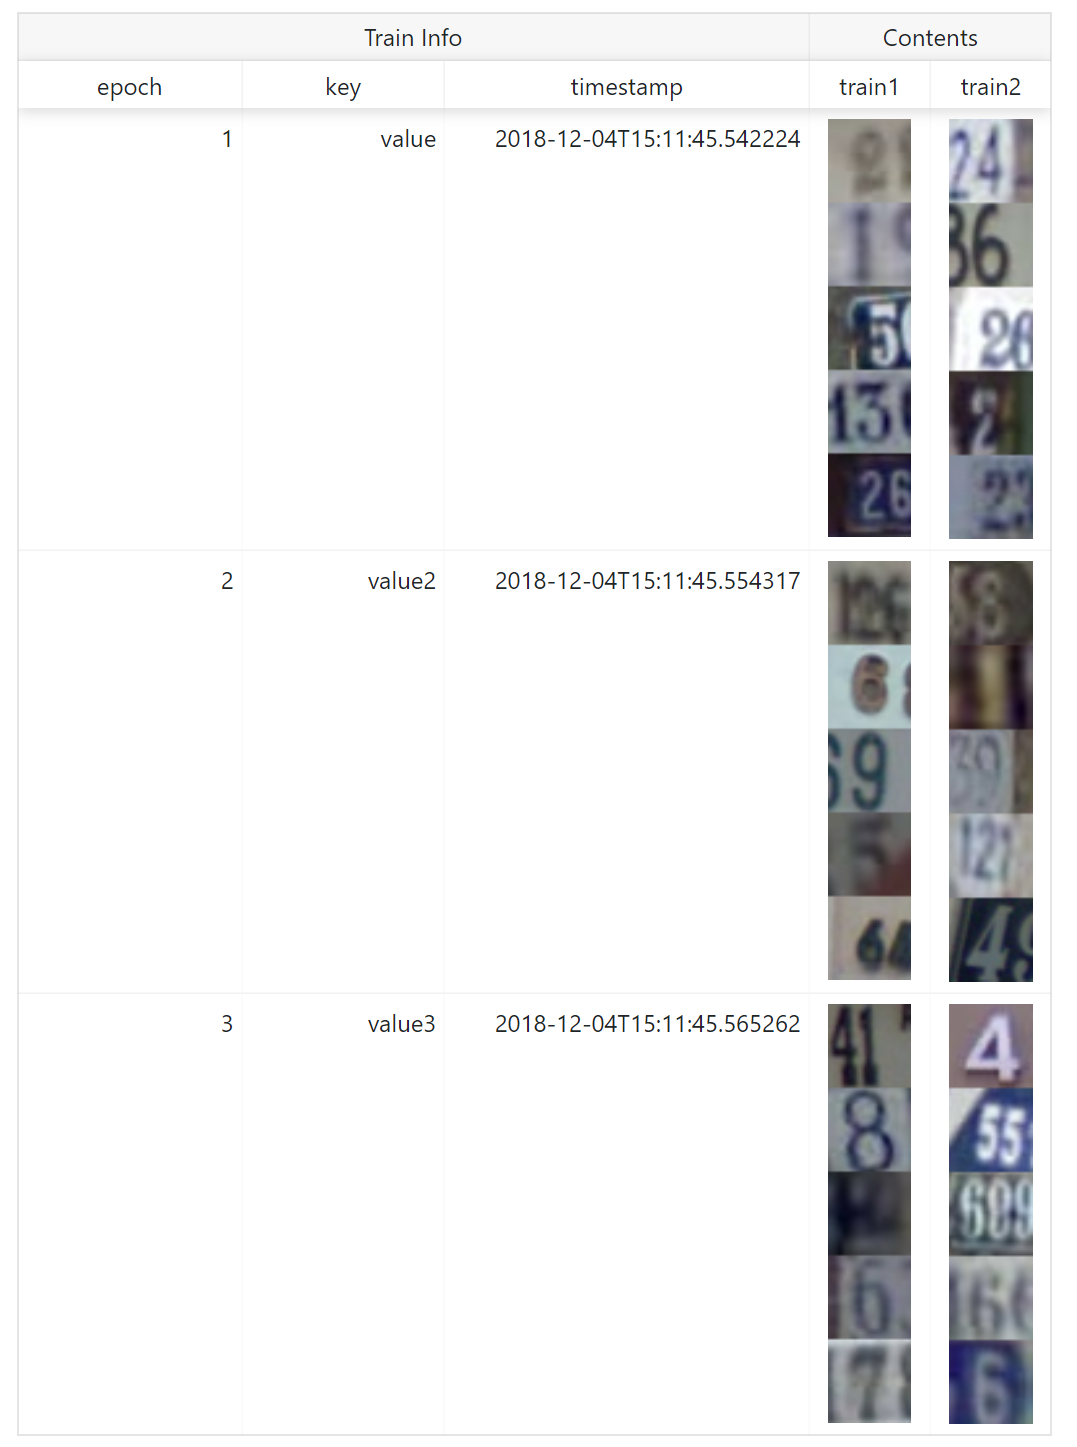
name is shown as column name. reporter also supports **kwargs to add other text information.
with summary.reporter(epoch=1, key='value') as r:
    r.image(images[0:5], name='train1')
    r.image(images[5:10], name='train2')
with summary.reporter() as r:
    r.image(images[10:15], name='train1')
    r.image(images[15:20], name='train2')
with summary.reporter() as r:
    r.image(images[20:25], name='train1')
    r.image(images[25:30], name='train2')
Image
Required Pillow to use this function.
Convert ndarray to image as PNG format, save, and report to ChainerUI server. image function has some options to customize showing.
- Channel position: Dimensions of
ndarrayis considered as batch, channel, height, width on default. If channel is not in 2nd (=[1]in 0-origin) dimension, setch_axisoption. For examplendarrayare batch, height, width, channel order, setch_axis=-1. - Batched or not: Images are considered as bathed array on default. If an array is not batched, set
batched=False. - Tiled: Batched array is showed in one line on default. If show tiled them, set
rowoption. For example, batch size is 20 and setrow=4, images are tiled 4x5 on web browser. - Color space: If images are not
RGBorRGBAcolor model, set the color mode withmodeoption. ChainerUI supportHSVcolor model, setmode='HSV'.
image(images[0:10]):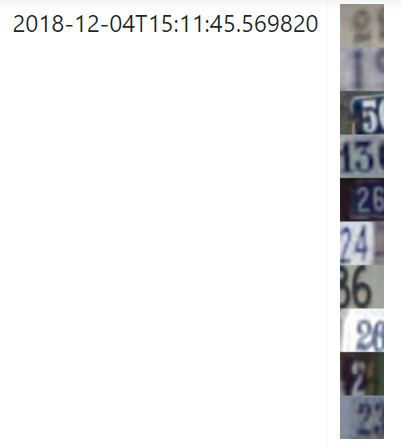
image(images[0:10], row=1):
image(images[0:10], row=2):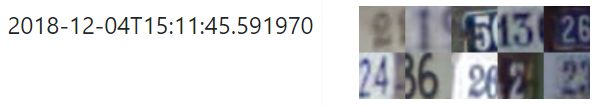
image(images[10], ch_axis=0, batched=False):
image(images_gs[0:9]):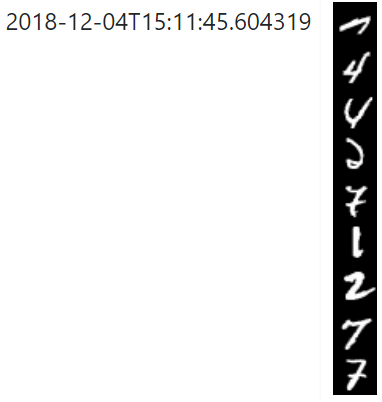
image(images_gs[0:9], row=1):
image(images_gs[0:9], row=3):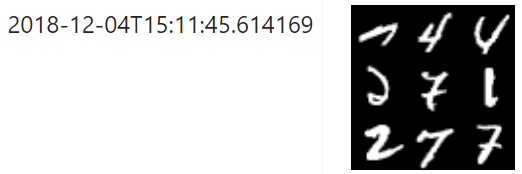
image(images_gs[9], batched=False):
Audio
Required Scipy to use this function.
Convert ndarray to audio as WAV format, save and report to ChainerUI server. audio function requires sample rate.
Text
Simply collect texts, save and report to ChainerUI server.